Silicon Valley Real Estate Market Update: March 2025 Insights and Analysis
Kevin Swartz | March 26, 2025
Silicon Valley

Kevin Swartz | March 26, 2025
Silicon Valley
Quick Take:
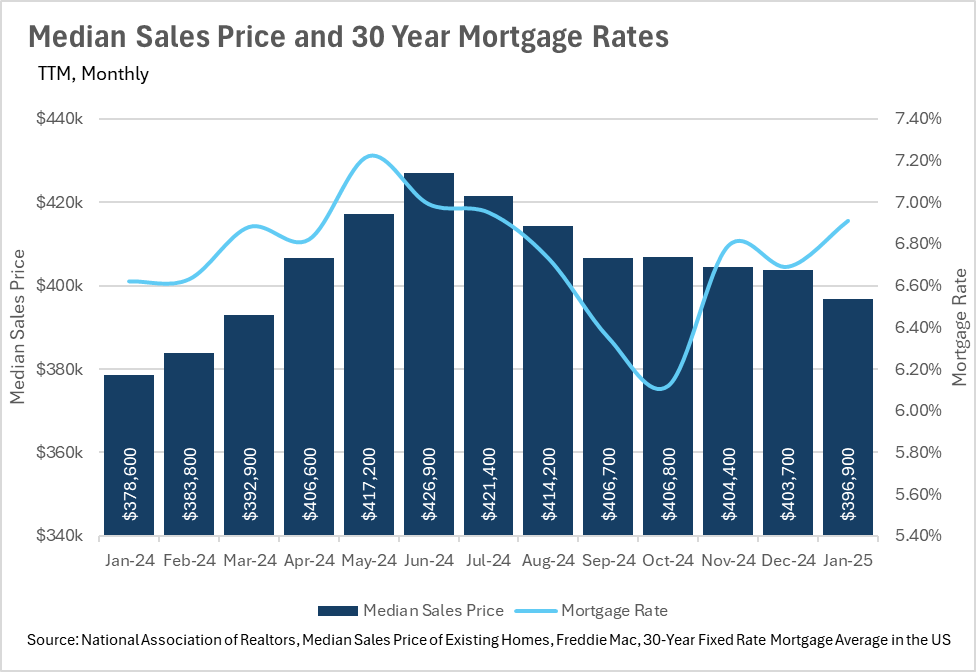
One of the headline issues in the real estate industry over the past few years has been, of course, the affordability (or rather the unaffordability) of homes. Unfortunately for new buyers, and more specifically first time home-buyers, this issue looks like it will persist throughout 2025. Mortgage rates remain comparatively high, and home prices largely have not given back their pandemic-era gains.
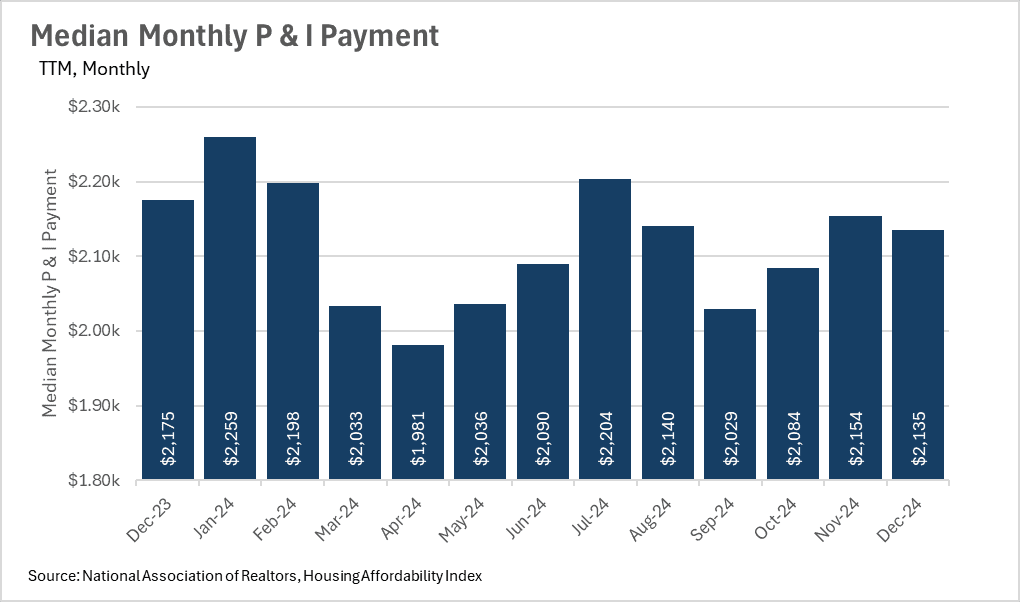
This has, of course, made the dreams of homeownership difficult to achieve for countless people around the country. With the median monthly principal and interest payment exceeding $2,100 per month on a nationwide level, people are struggling to afford the purchase of a new home!
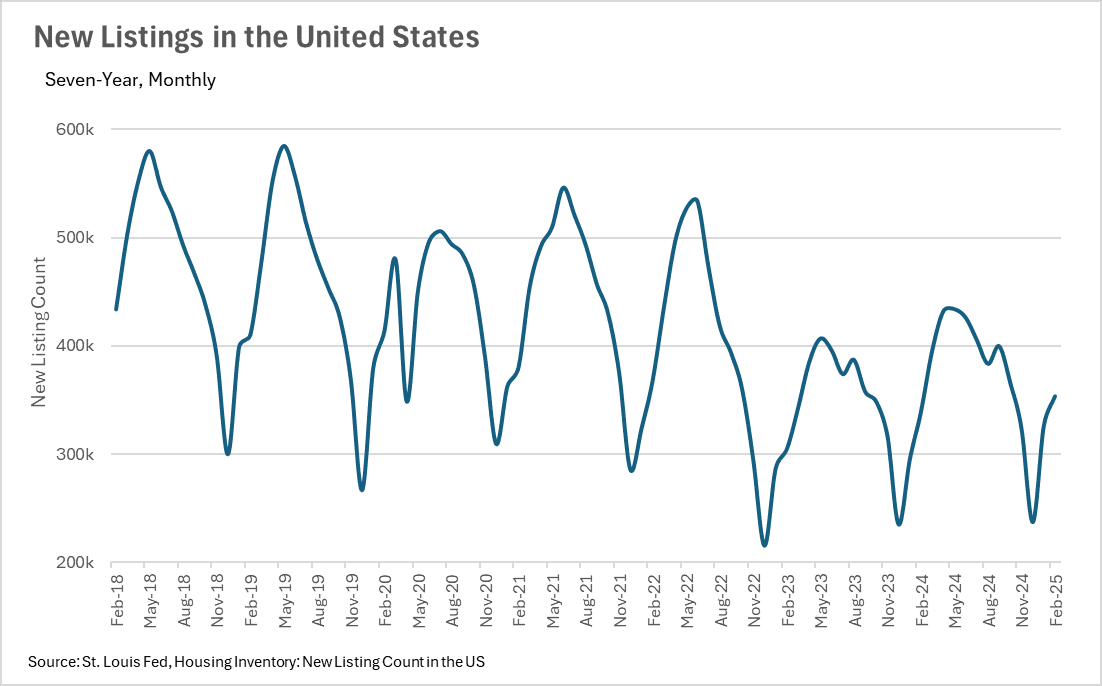
Fortunately for the market, there are plenty of new homes hitting the market though. While there are countless people sitting on the sidelines, waiting for lower interest rates to sell their current home and buy a new one, some of these holdouts are giving up and listing their homes. The writing seems to be on the wall, meaning more and more people are giving up on the thought that we will see lower interest rates in the short term, causing them to list their homes.
This has resulted in a pleasant jump in new home listings, despite us being at the tail end of the slow season. In the month of february, we saw more than 353,000 homes hit the market nationwide. This represents a 4.21% increase on a year-over-year basis, and an 8.15% increase on a month-over-month basis!
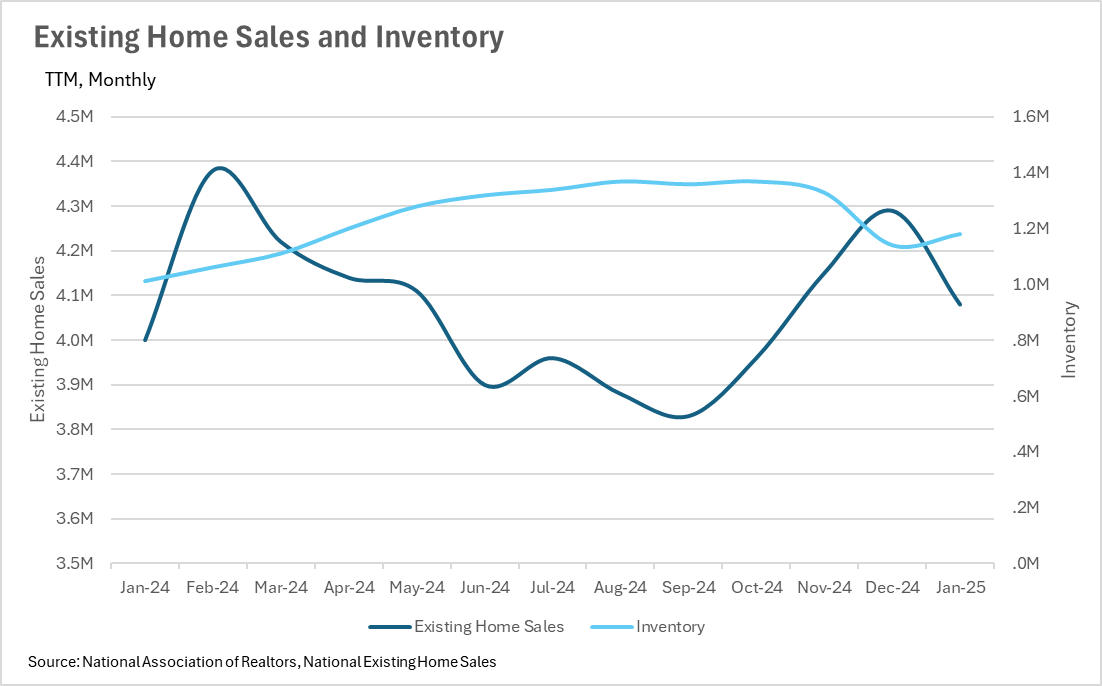
Since we are seeing new inventory hit the market and a steady level of demand, this is causing inventories to build, which is a great sign for those looking to enter the market! In the month of January, there were 1,180,000 homes listed on the market, representing a 16.83% increase on a year-over-year basis and a 3.51% increase on a month-over-month basis. At the same time, we’re seeing demand stagnate a bit, with 4,080,000 homes sold in January, representing a 2% increase when compared to last year and a 4.9% decrease when compared to last month!
Although a top-tier property will likely end up in a bidding war, no matter if it’s in Kansas City or Calabasas, this increase in inventory could mean that there are some deals to be had on listings that sit on the market for a few weeks.
While there are areas that deviate from the national trends, this is generally what's happening nationwide. Below, you'll find a local lowdown that provides you with the in-depth coverage of your area that you need. We will continue to monitor the housing market and overall economy to help guide you in buying or selling your home.
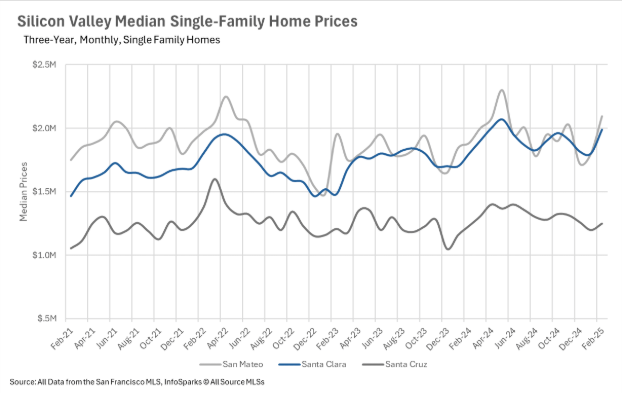
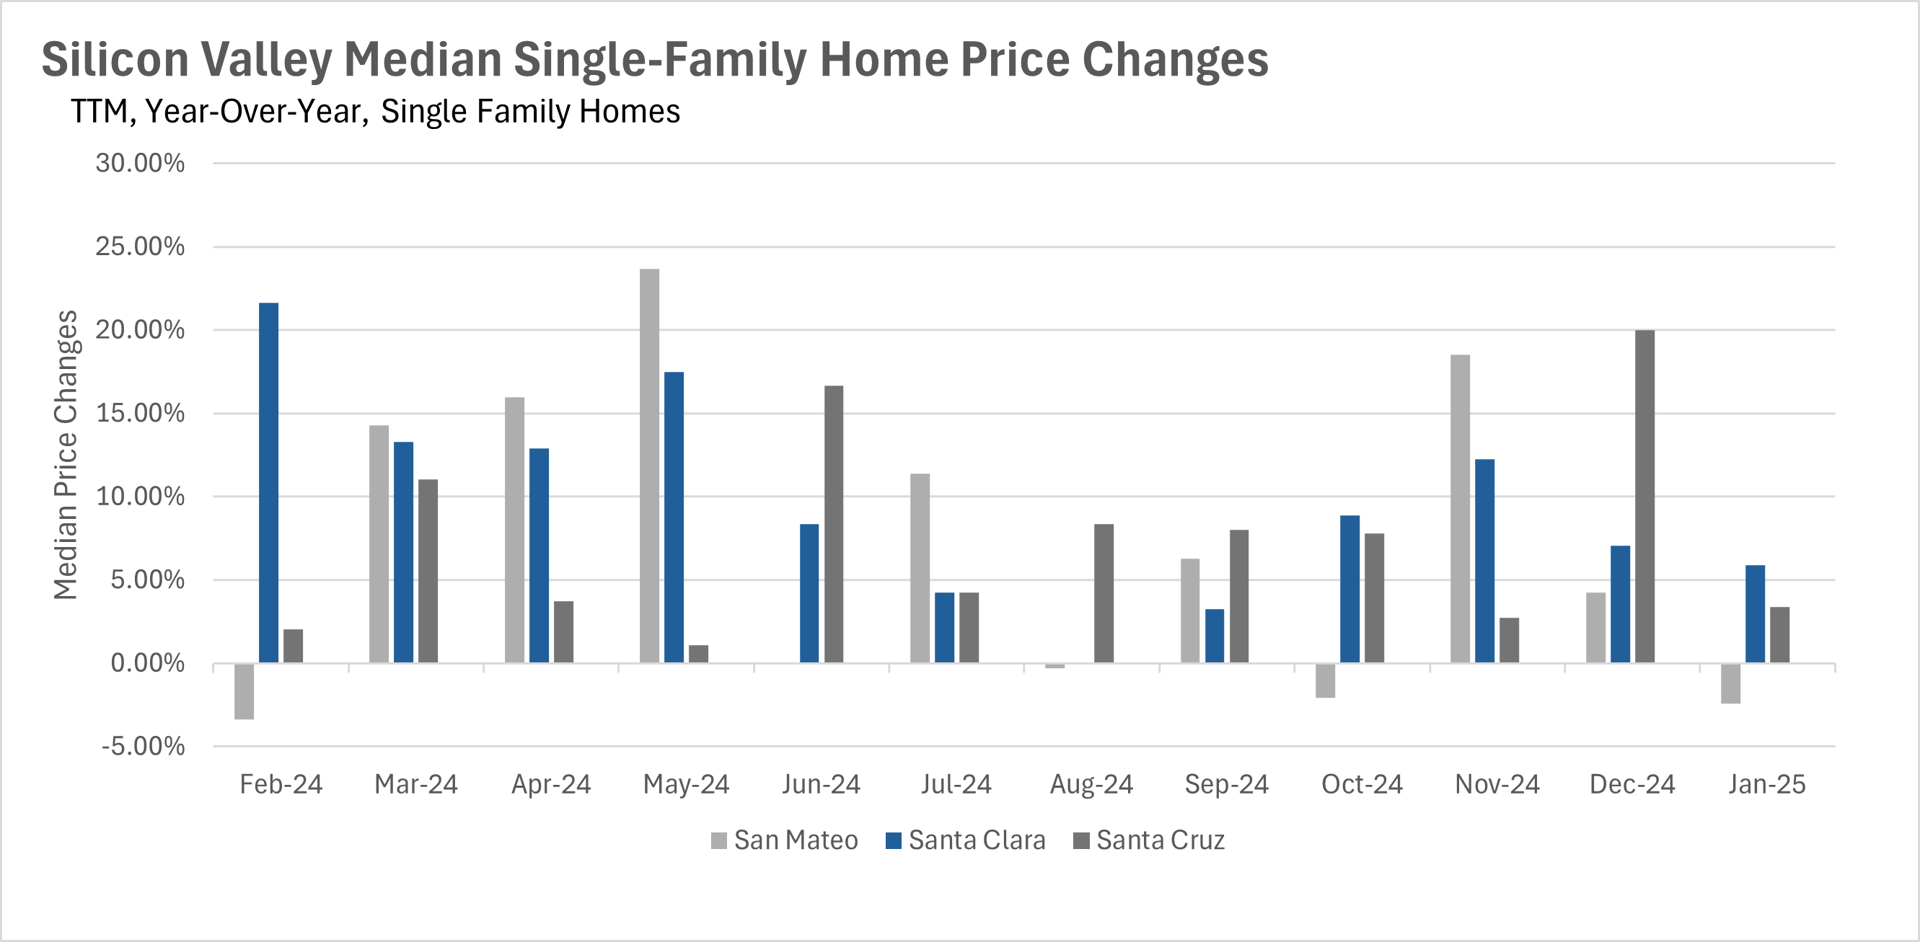
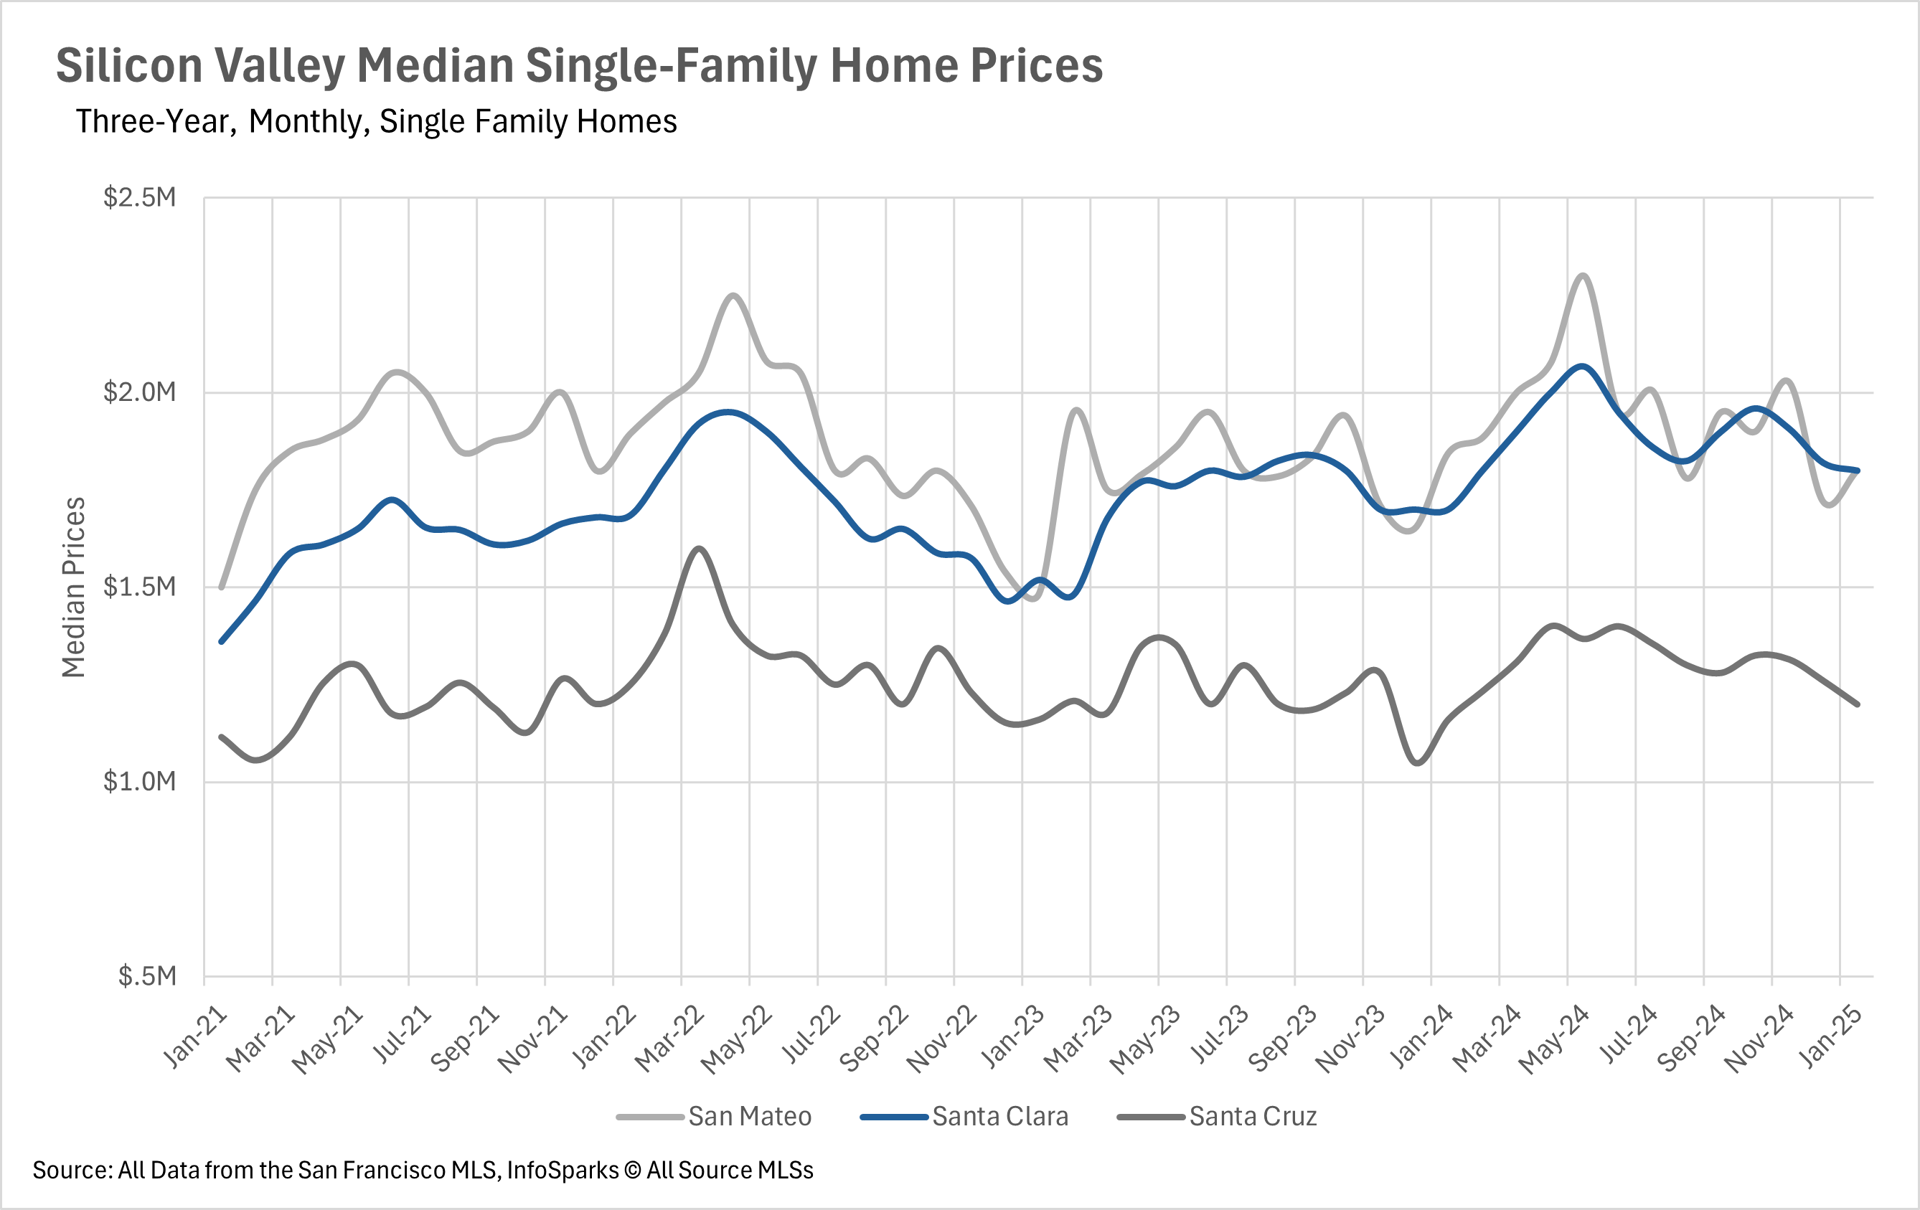
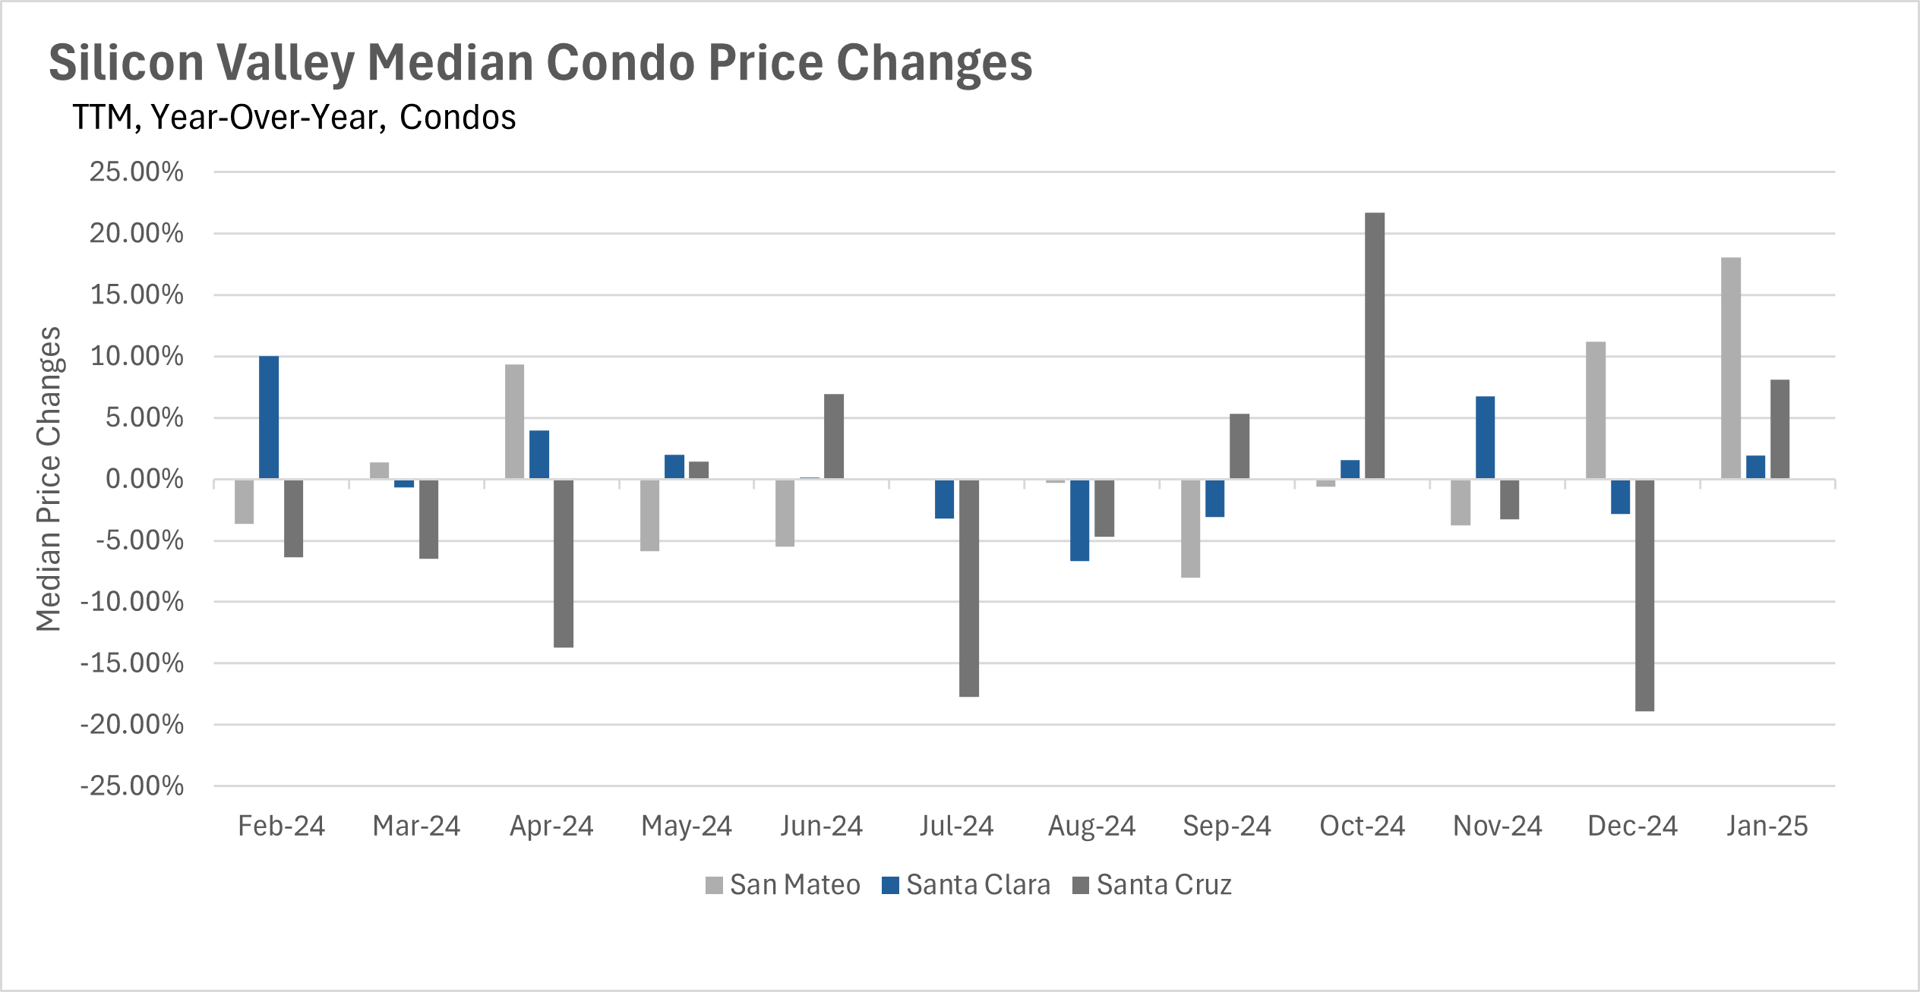
Throughout the entirety of 2024, Silicon Valley remained seemingly unphased by the increase in mortgage rates, and the prevailing thought that interest rates would remain higher for longer. As of right now, it looks like the area is unlikely to buck that trend this year, as we see stellar growth in both San Mateo and Santa Clara Counties once again. These markets saw an 11.17% increase and a 10.42% increase, respectively, on a year-over-year basis.
Although the median sale prices in Santa Cruz are not growing nearly as quickly as they are in Santa Clara and San Mateo counties, the market is still holding up well, ending February with a 1.42% year-over-year increase in median sale prices.
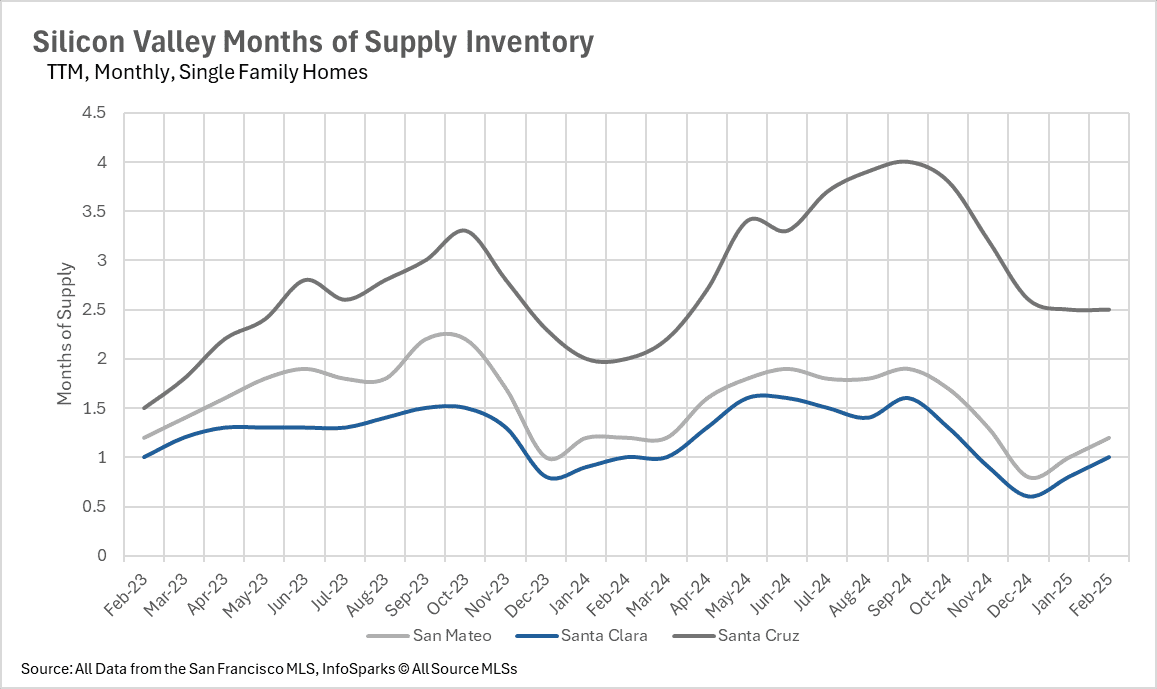
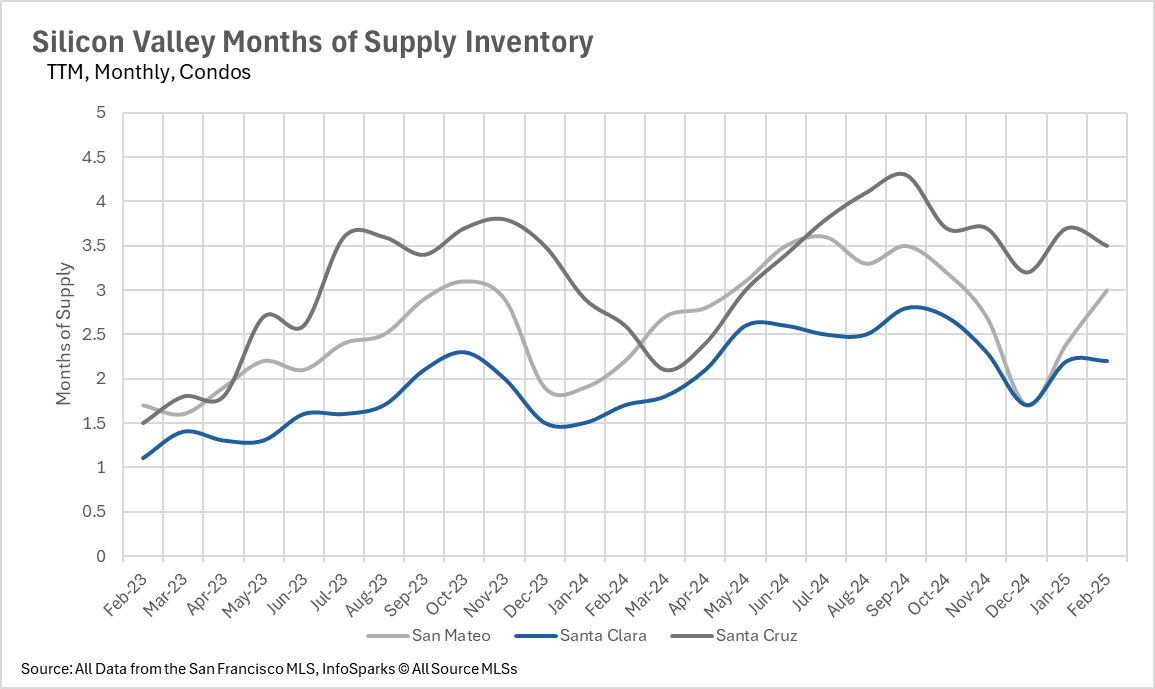
When determining whether a market is a buyers’ market or a sellers’ market, we look to the Months of Supply Inventory (MSI) metric. The state of California has historically averaged around three months of MSI, so any area with at or around three months of MSI is considered a balanced market. Any market that has lower than three months of MSI is considered a seller’s market, whereas markets with more than three months of MSI are considered buyer’s markets.
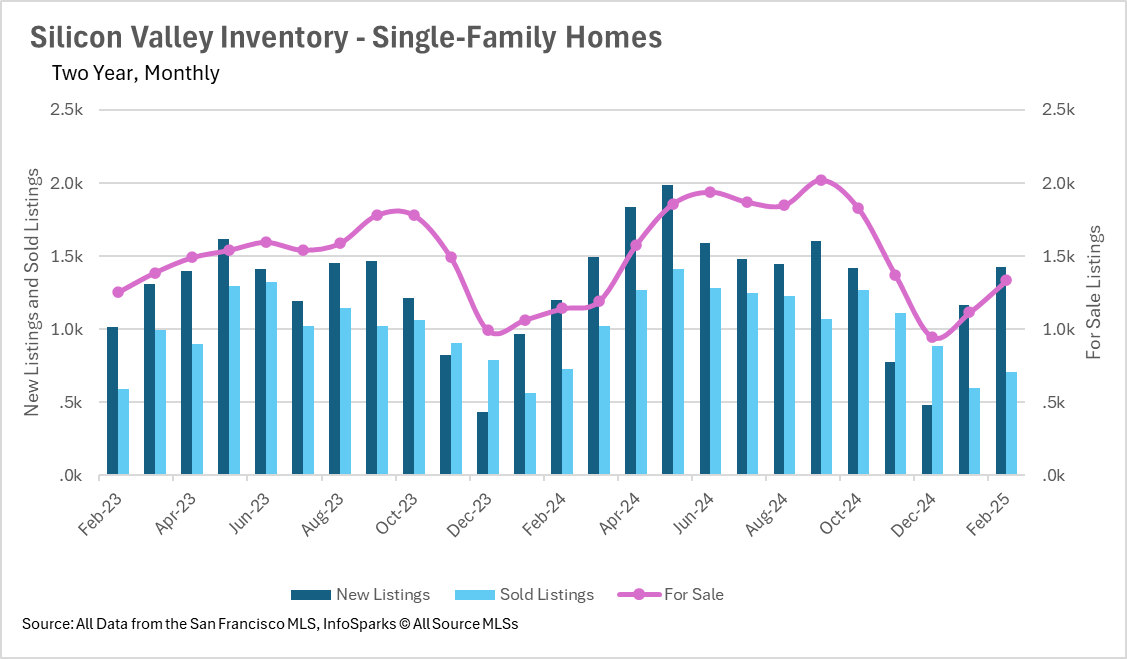
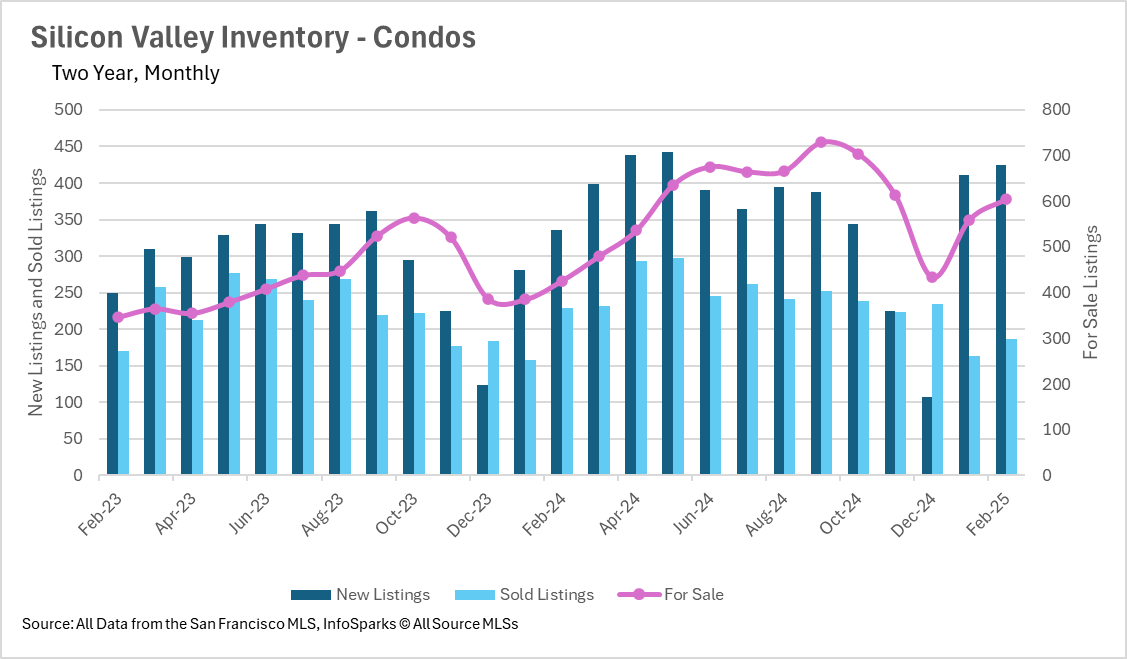
With 1.2, 1, and 2.5 months' worth of single-family home supply on the market, San Mateo, Santa Clara, and Santa Cruz Counties are all staunchly sellers’ markets. However, when it comes to the condo market, things are considerably more balanced. There are 3 and 3.5 months’ worth of condo supply on the market in San Mateo and Santa Cruz Counties, respectively, which means there might be some room for buyers to make a deal! However, Santa Clara County only has 2.2 months’ worth of condo supply on the market, so the sellers certainly have the upper hand at the negotiation table there.

Trends, prices, and insights shaping Silicon Valley housing this winter

Trends, prices, and insights shaping Silicon Valley housing this fall


You’ve got questions and we can’t wait to answer them.