Leave a Message

Thank you for your message. We will be in touch with you shortly.

Silicon Valley Real Estate Market Update: July 2025 Insights and Analysis

Kevin Swartz  |  July 18, 2025

Silicon Valley

Silicon Valley Real Estate Market Update: July 2025 Insights and Analysis

The Big Story

Quick Take:

  • Affordability remains an issue nationwide, as the median monthly P&I payment ticked up by 10.15% on a year-over-year basis at the end of April.
  • Mortgage rates have continued to hold the mid-six percent range that we’ve seen for over six months.
  • Inventories continue to climb throughout the country, while home sales start to slow down.
  • The recent global economic and geopolitical instability that we’ve seen likely won’t help the market, as uncertainty may lead people to stay where they are.
Note: You can find the charts & graphs for the Big Story at the end of the following section.
*National Association of REALTORS® data is released two months behind, so we estimate the most recent month’s data when possible and appropriate.
 

The housing affordability issue continues to grow

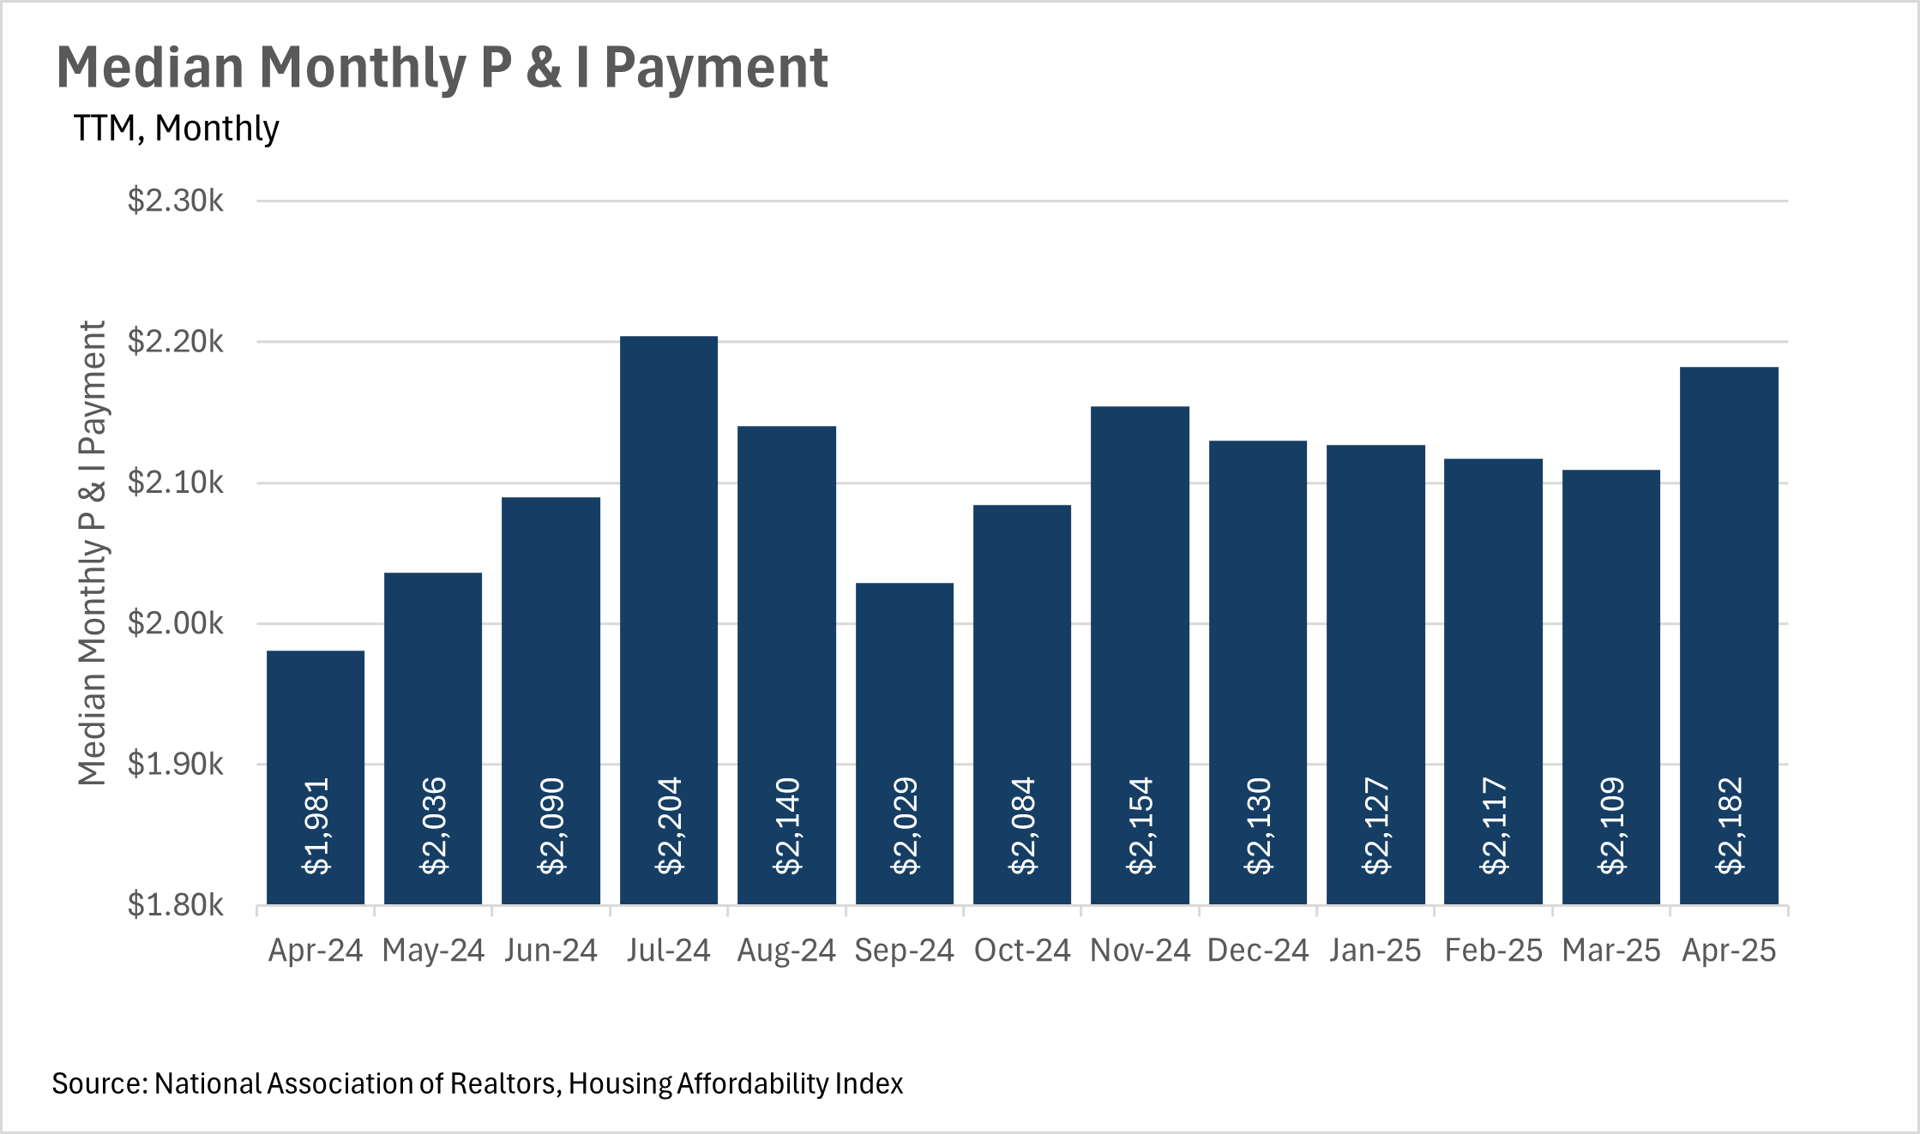
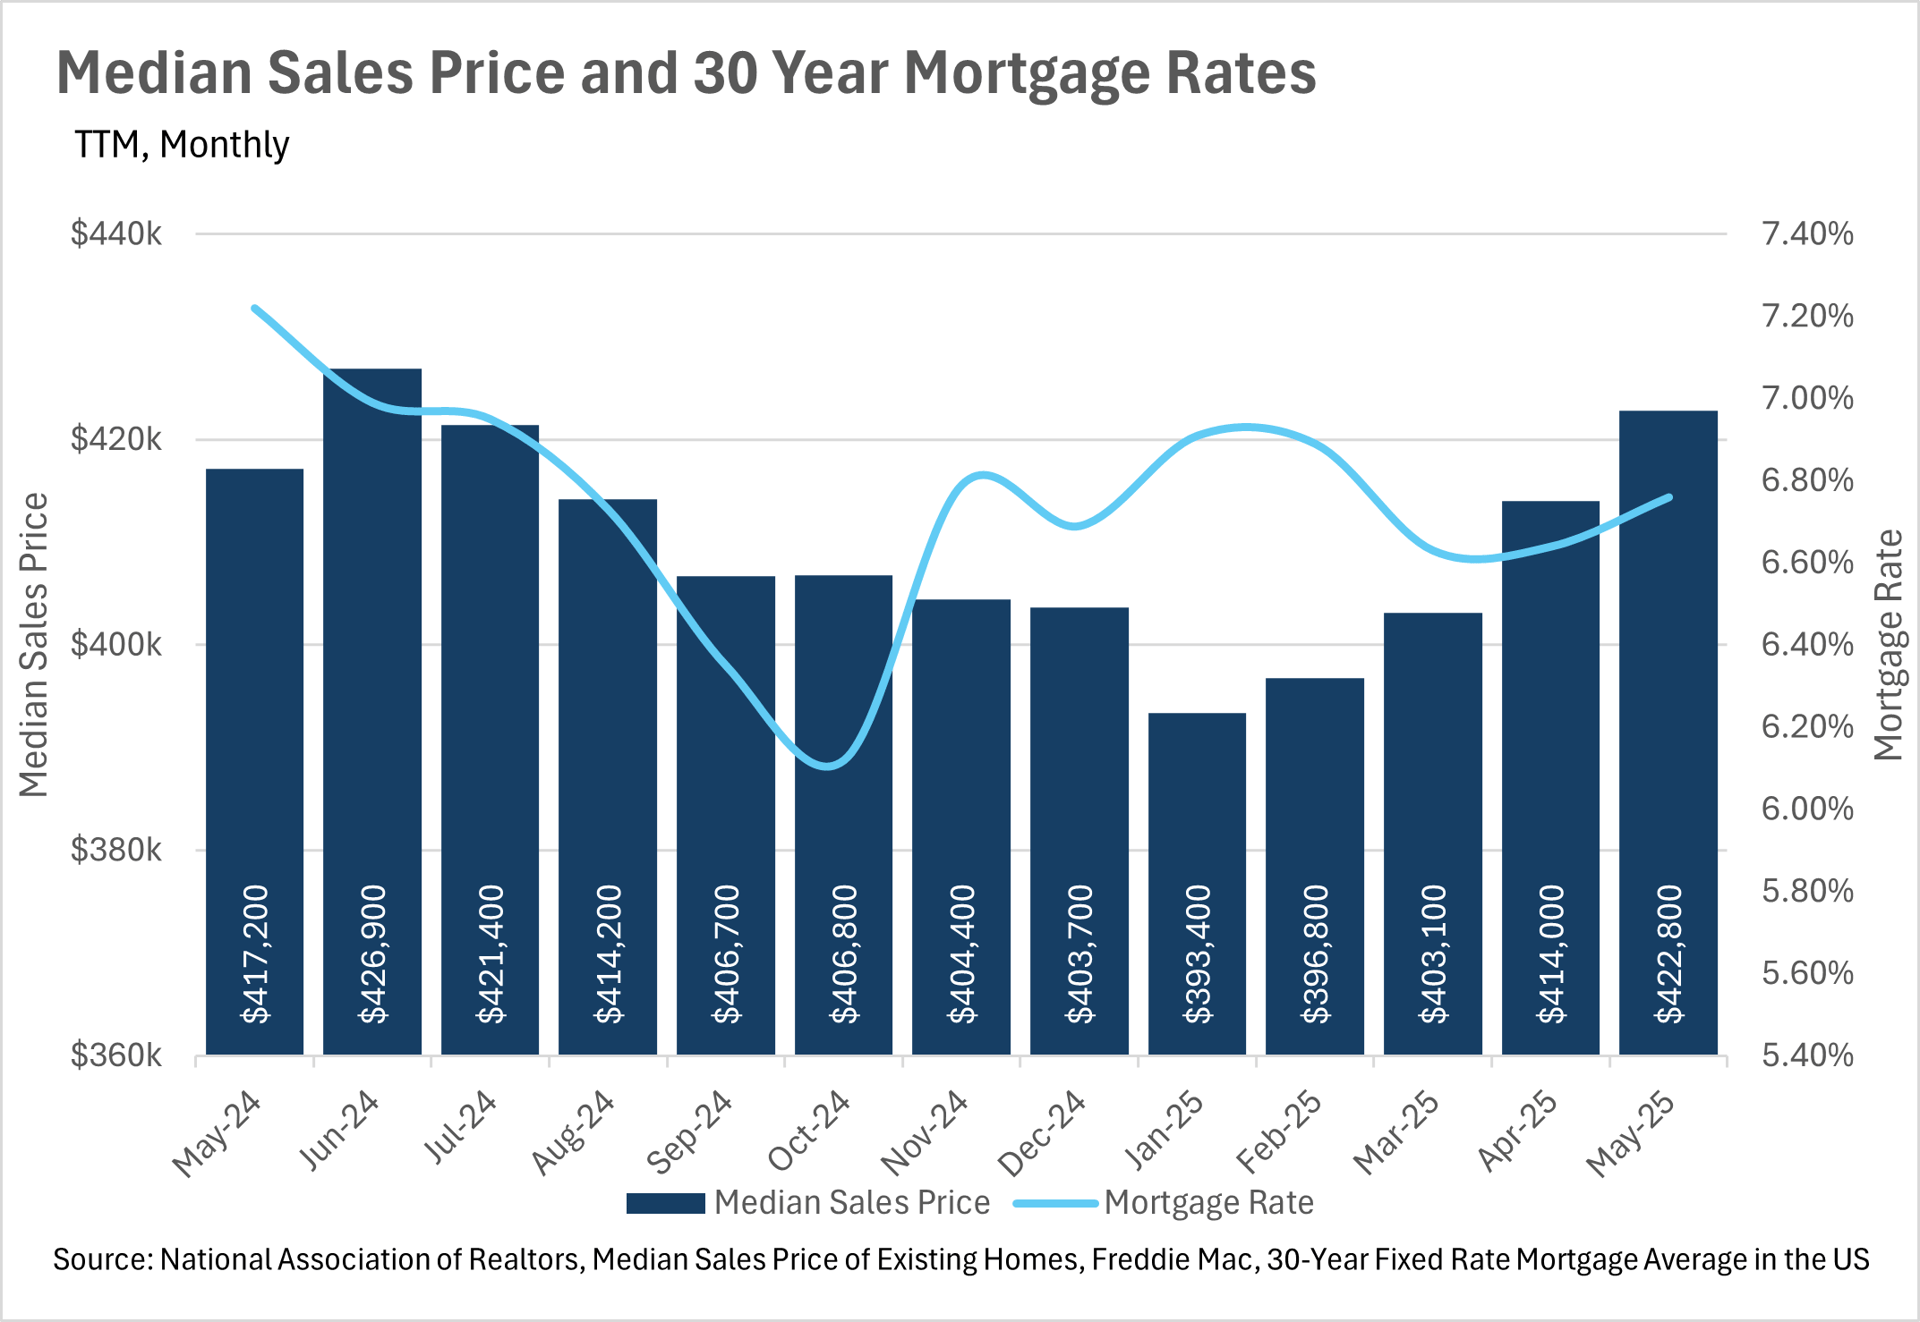
As we all know, housing affordability has been a problem on a national scale for quite a few years at this point.  At this point in time, many find it hard to believe that the housing market will return to pre-pandemic levels in terms of affordability at any point in the near future.  Unfortunately, things have not gotten much better, as the median monthly P&I payment increased by 10.15% on a year-over-year basis, to $2,182 in the month of April.  This jump in P&I payment represents a drastic month-over-month jump of 3.46%.  This jump is actually quite perplexing, as median home sale prices have increased by 1.34% on a year-over-year basis, while mortgage rates have actually come down.

Mortgage rates remain stagnant in the mid-six percent range

For the past few months, mortgage rates have remained fairly stable, in the mid-six percent range.  Although the stability that we’ve seen is a good thing, the levels they’ve stabilized at are quite a bit higher than recent historical averages.  This, of course, is one of the leading causes of the affordability issues that we’ve seen recently.  

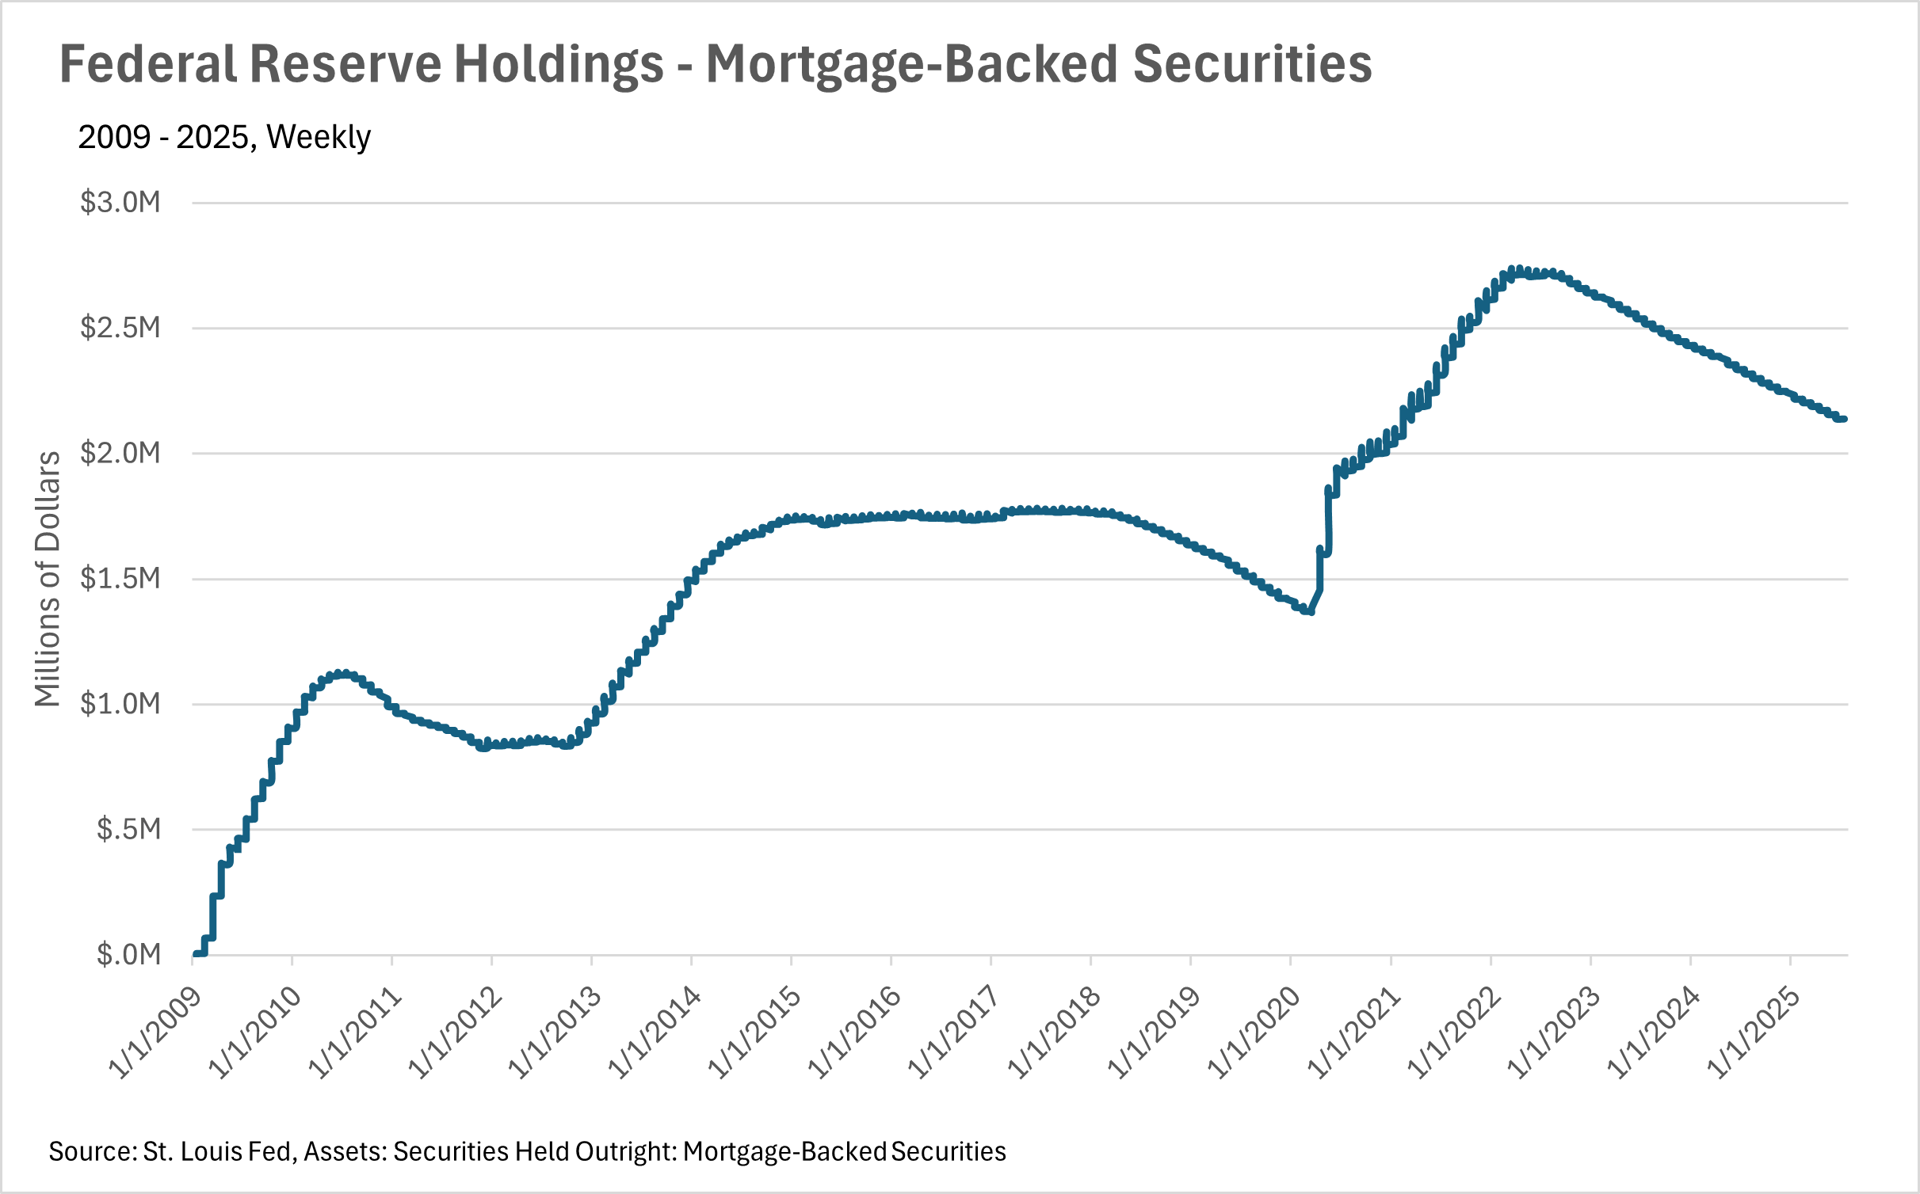
It is worth noting, though, that we might see some discounted rates toward the back half of the year.  Although the Fed has not touched the federal funds rate in nearly a year, the Fed chairman has signaled that one to two rate cuts are expected by the end of the year, so long as there aren’t any further spikes in inflation.

Inventories are building at an incredibly rapid rate

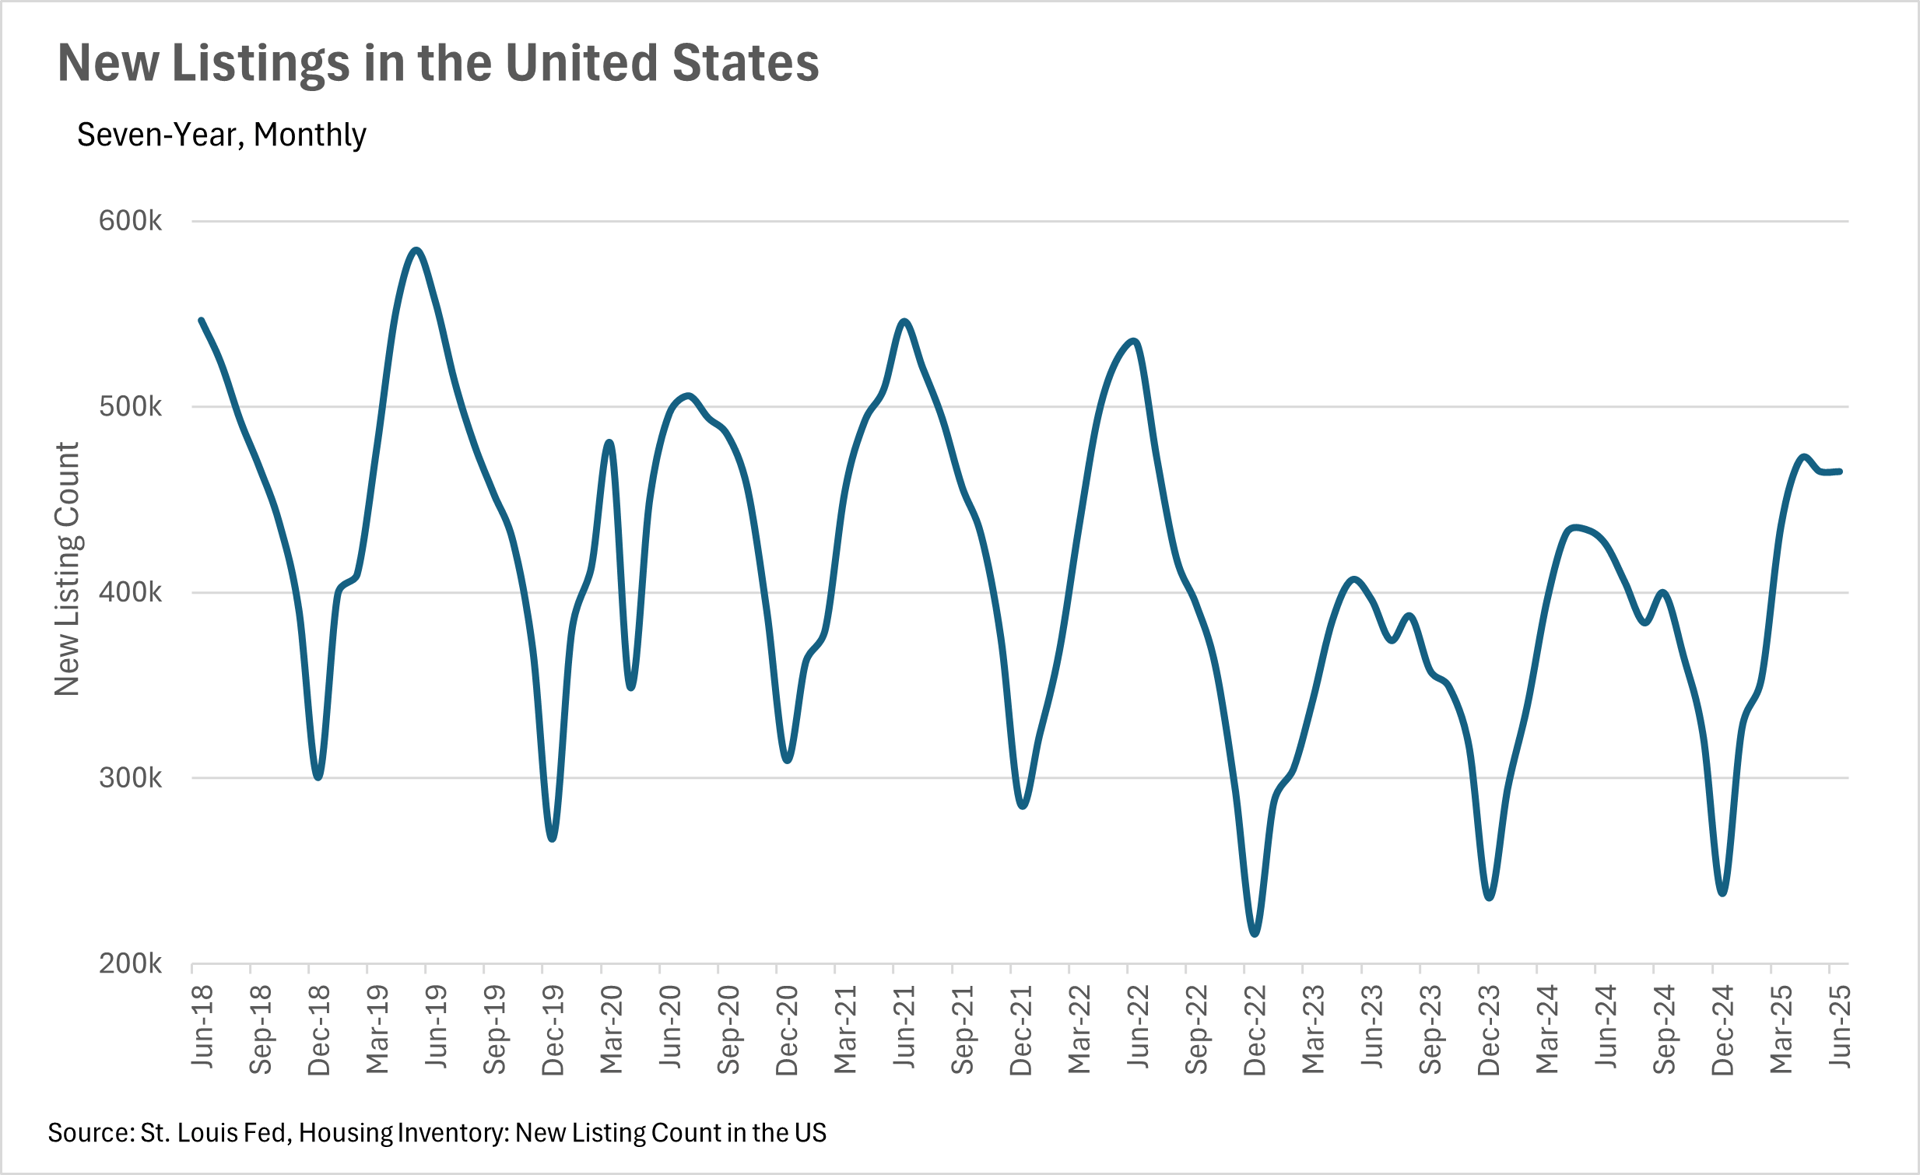
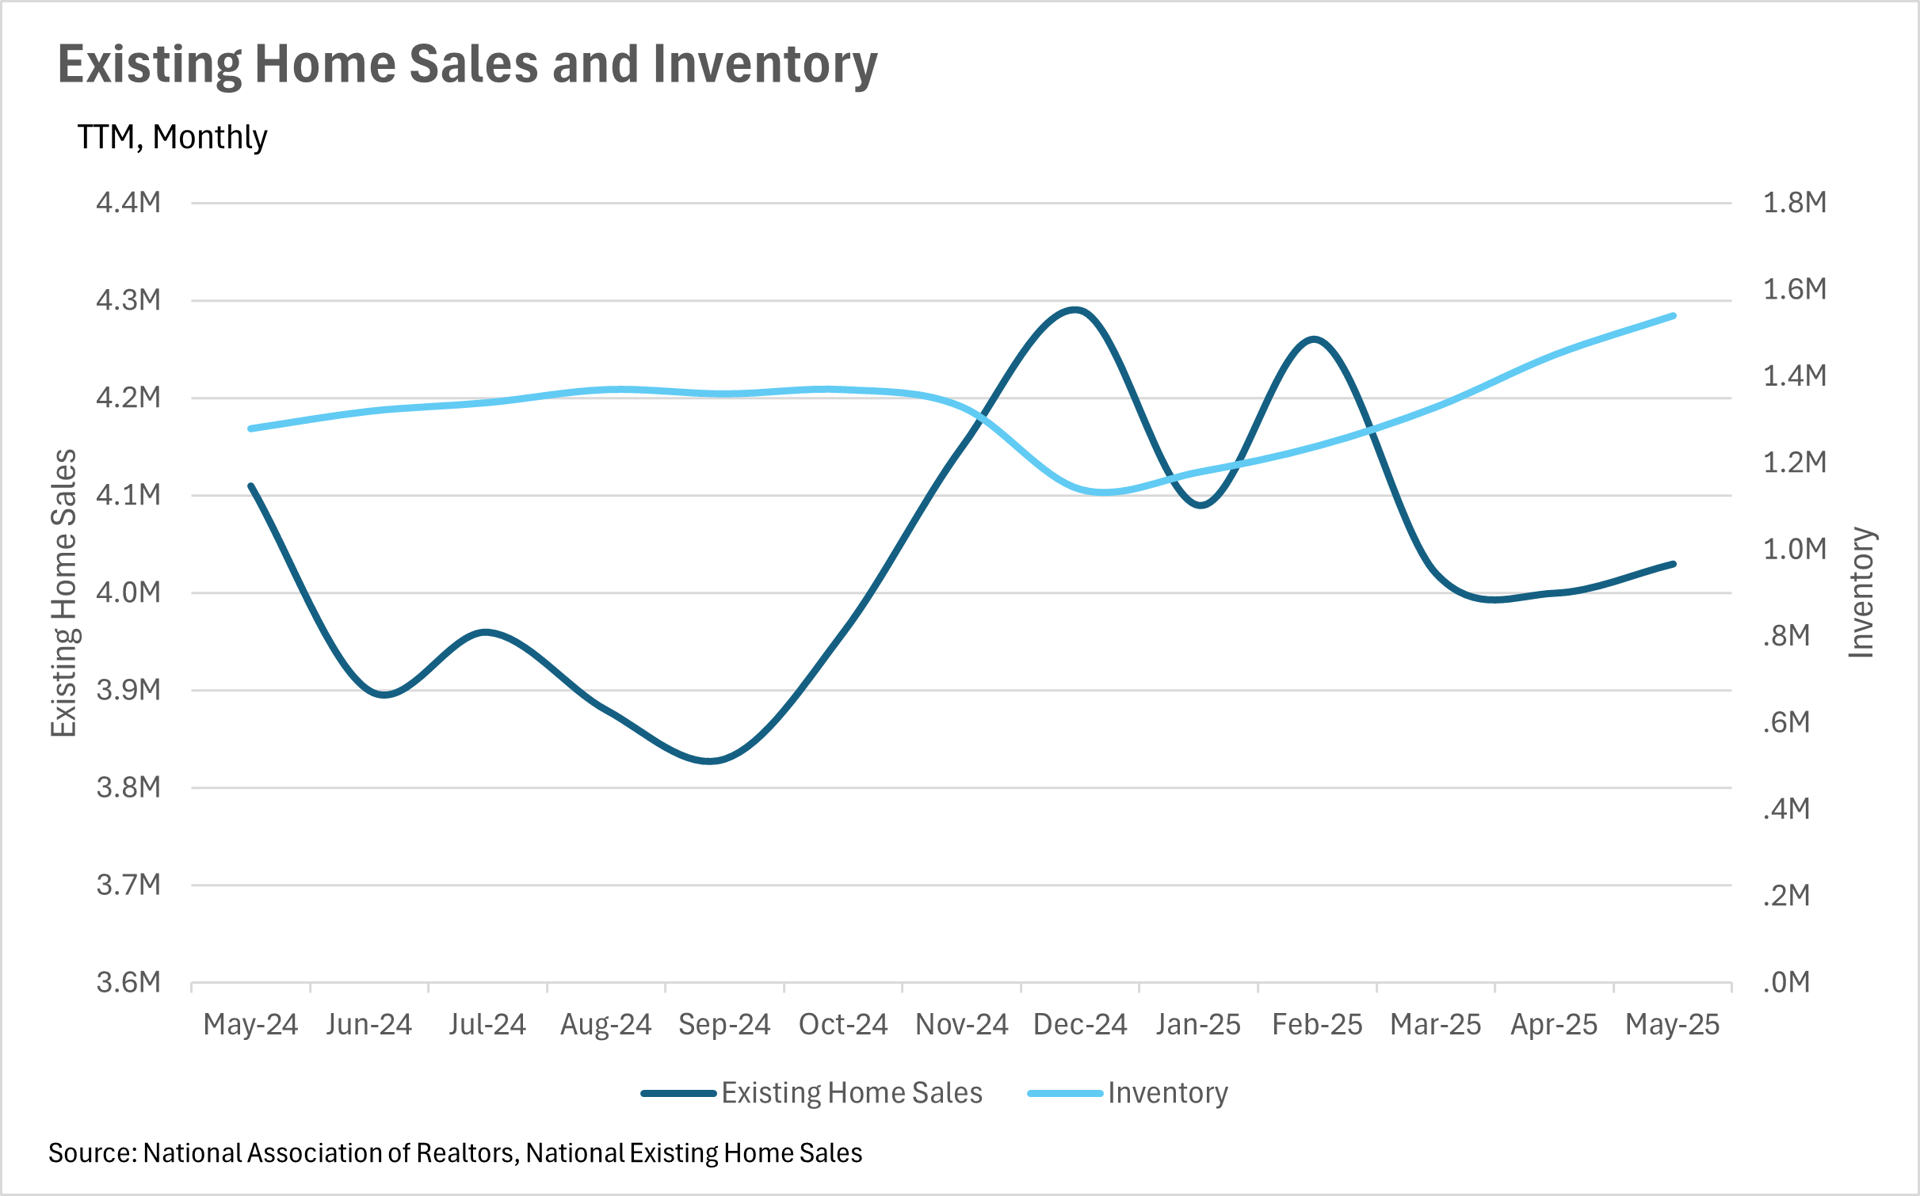
What we have been seeing in terms of inventories in California has been echoed on a nationwide scale.  Fewer homes are being sold, with 1.95% fewer existing home sales when compared to this time last year.  At the same time, 9.95% more new listings have hit the market on a year-over-year basis.  This has led overall inventory to increase by a whopping 20.31% on a year-over-year basis.  

As inventories are piling up, negotiating power will slowly shift from the sellers to the buyers, as buyers have more opportunities, and don’t need to move nearly as quickly as they had to just a year earlier. 

Global economic and geopolitical instability are making both buyers and sellers more cautious

In any market, but especially the real estate market, instability is incredibly detrimental.  Given the recent rise in uncertainty around tariffs and employment, coupled with continued instability in Europe and the Middle East, both buyers and sellers have become much more cautious.  Inventories are growing throughout California and the broader United States.  However, for those who have the capital and a long time horizon, times like these can represent excellent buying opportunities, as good deals are easier to come by.  

However, it’s important to note that this is just what we have been seeing at the national level.  California markets have largely remained resilient, which we’ll delve into more in the local lowdown section below. 


Big Story Data

The Local Lowdown

 
Quick Take:
 
  • The single-family home market has remained incredibly resilient, while cracks have begun to form in the condo market.
  • Silicon Valley inventory levels seem to have reached a local peak in May and have begun to decrease in June.
  • Condos are spending approximately 2-3x longer on the market when compared to this time last year.
Note: You can find the charts/graphs for the Local Lowdown at the end of this section.
 

The third straight month of median sale price declines in the condo market 

Although we saw some healthy growth throughout most of the single-family home market in June, with median sales prices up 3.21% and 7.18% on a year-over-year basis in San Mateo and Santa Clara counties, respectively, and down by 4.64% in Santa Cruz County, a much different story is playing out in the condo market.  The condo market just saw its third straight month of median sale price declines, which were fairly drastic too.  Santa Clara County median sale prices saw a year-over-year decline of 8.79%, San Mateo County decreased by 11.84%, and Santa Cruz County saw a huge 13.52% drop. 
 

Inventories seem to have peaked for the year in Silicon Valley

It seems like inventories in both the single-family home and condo markets reached their local peak in the month of May, as inventories dropped in June.  Despite this local peak, inventories are still much higher than they were around this time last year, with the single-family home market reporting 14.18% more active listings and the condo market reporting 24.89% more active listings.  This is largely due to the fact that the number of new homes being added to the market is currently shrinking at a faster rate than the number of homes being sold.
 

The average condo is spending 245% more time on the market in Santa Cruz County

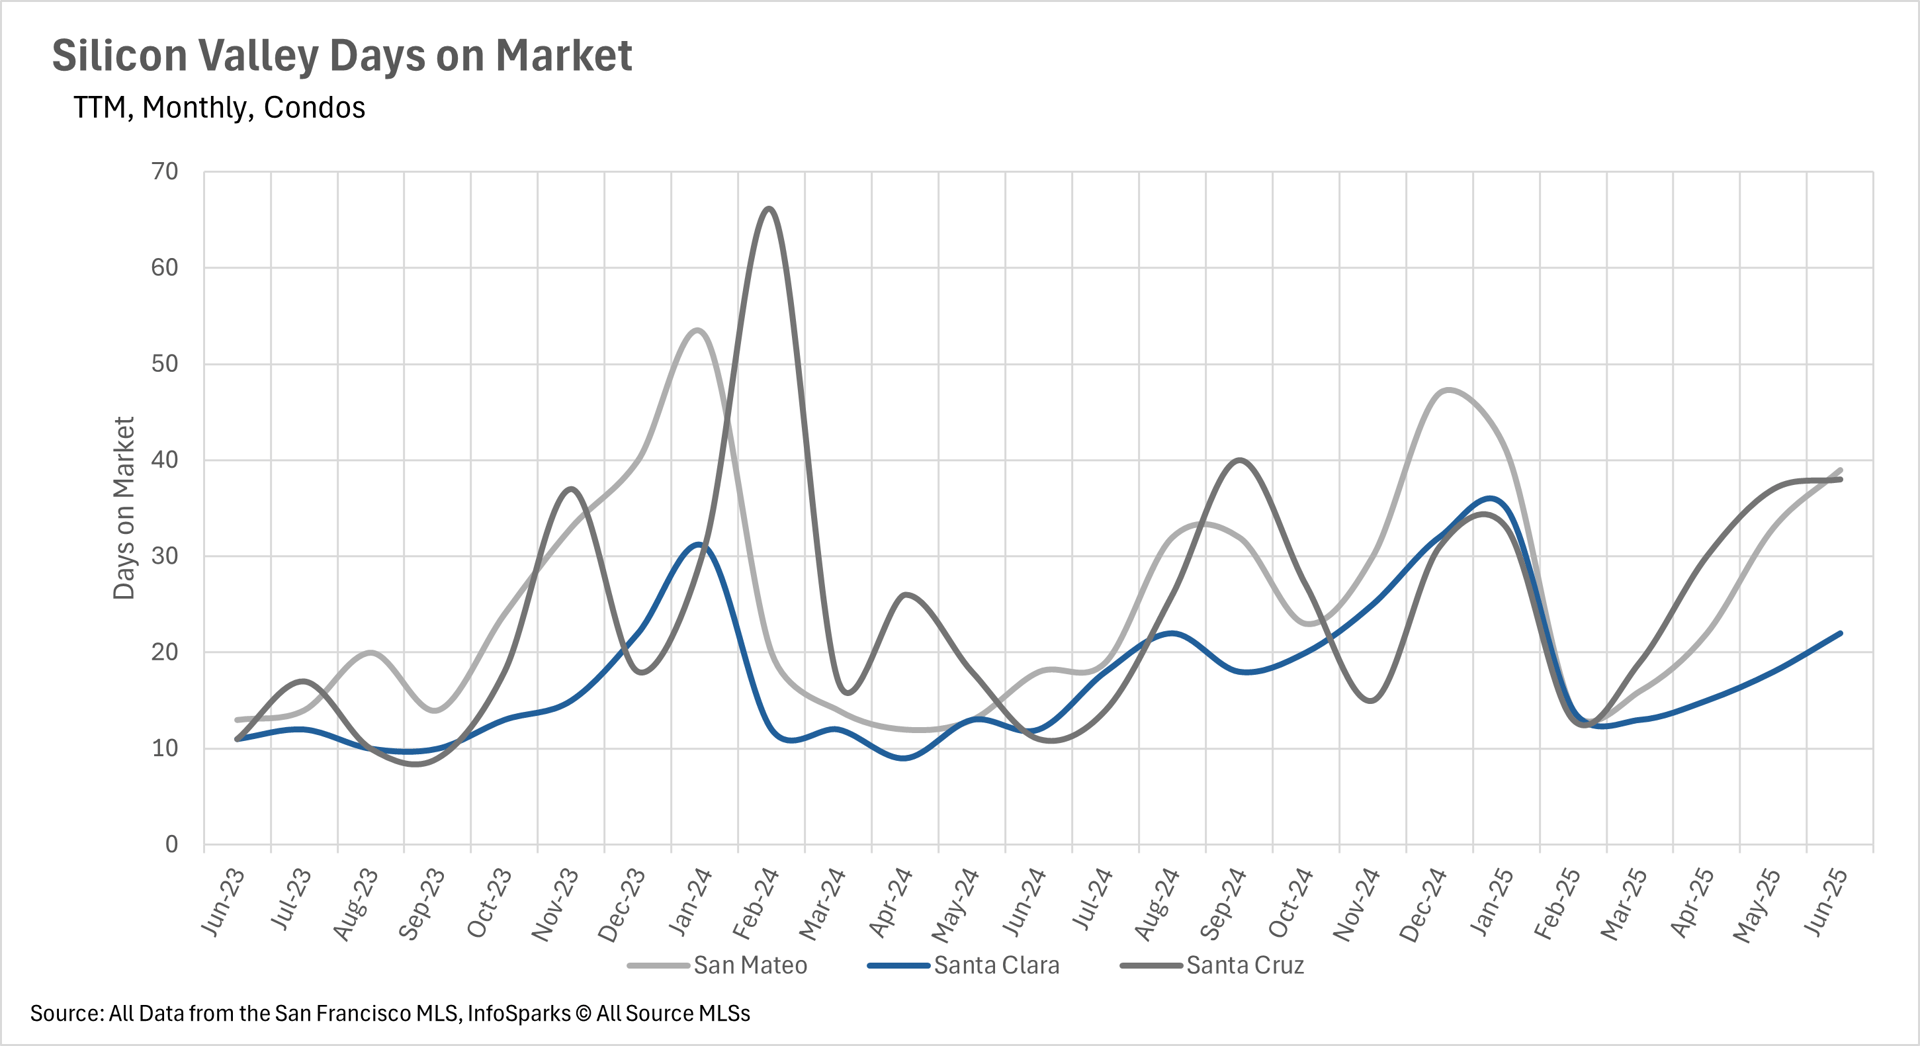
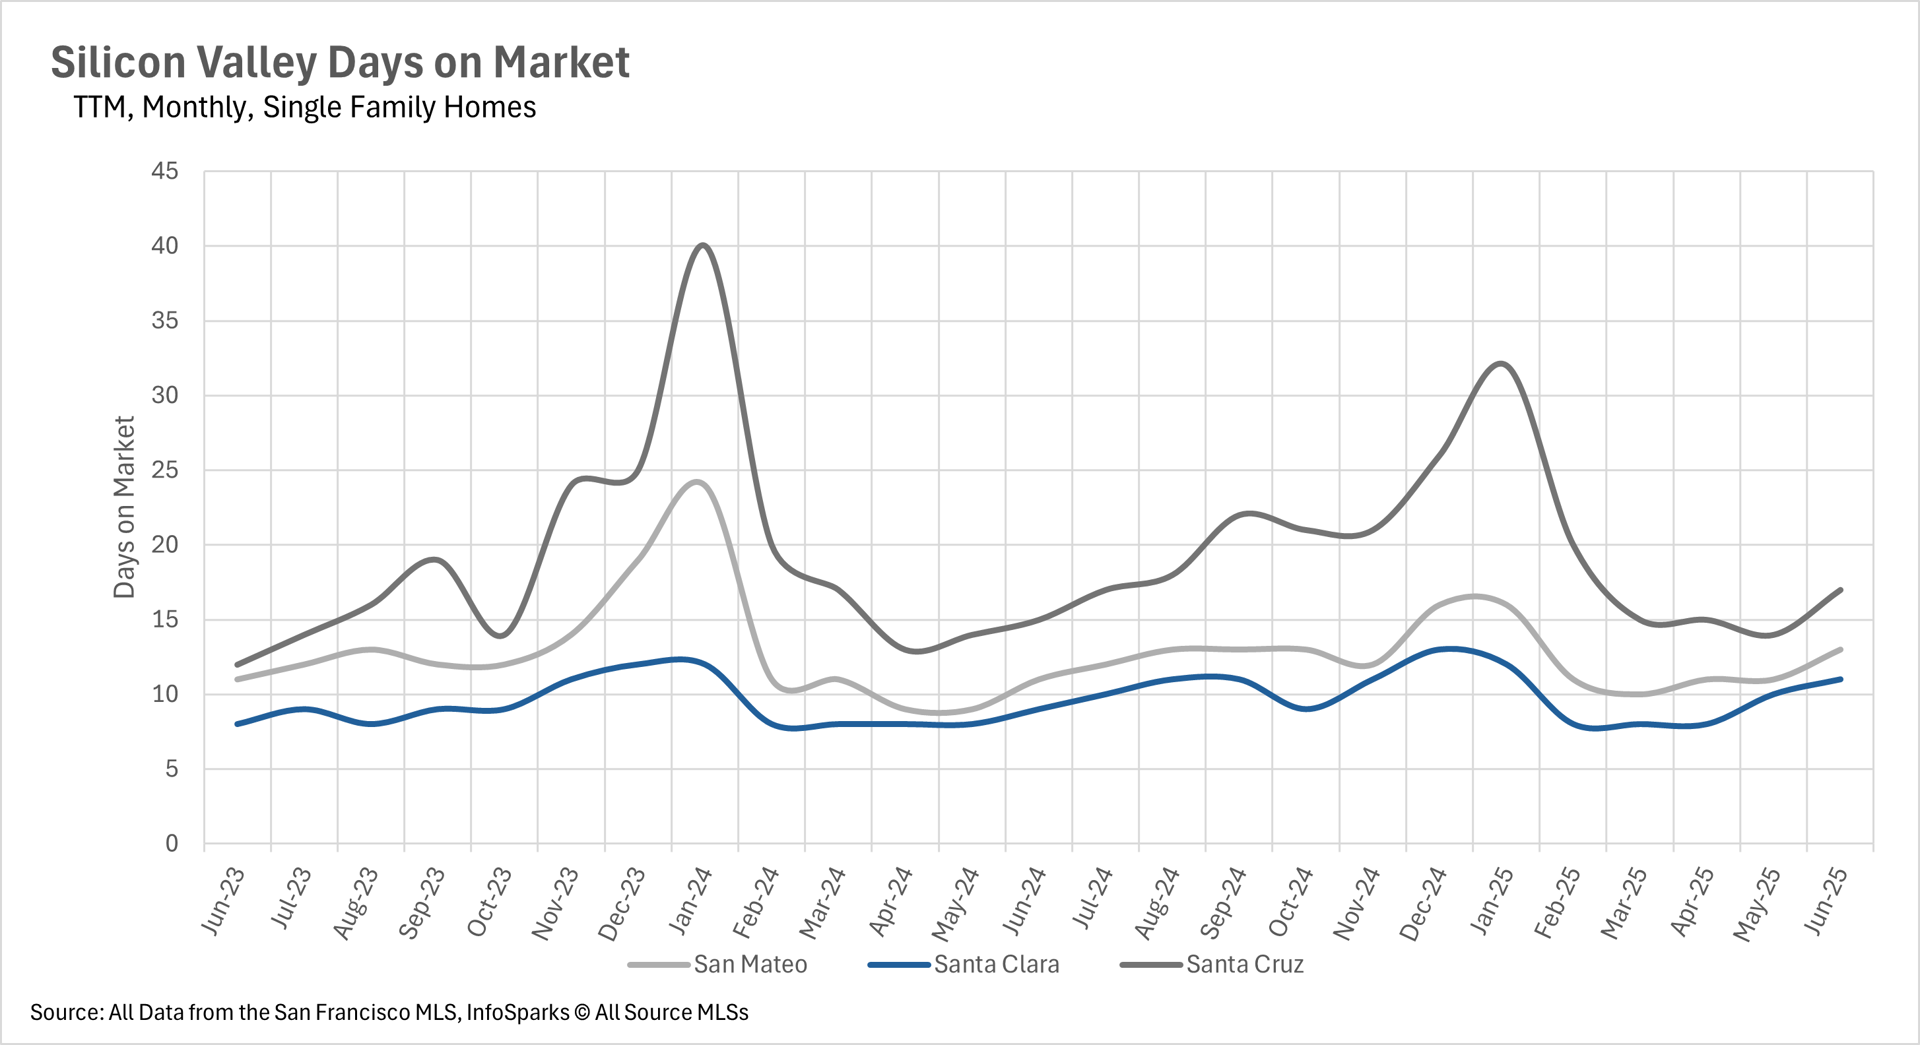
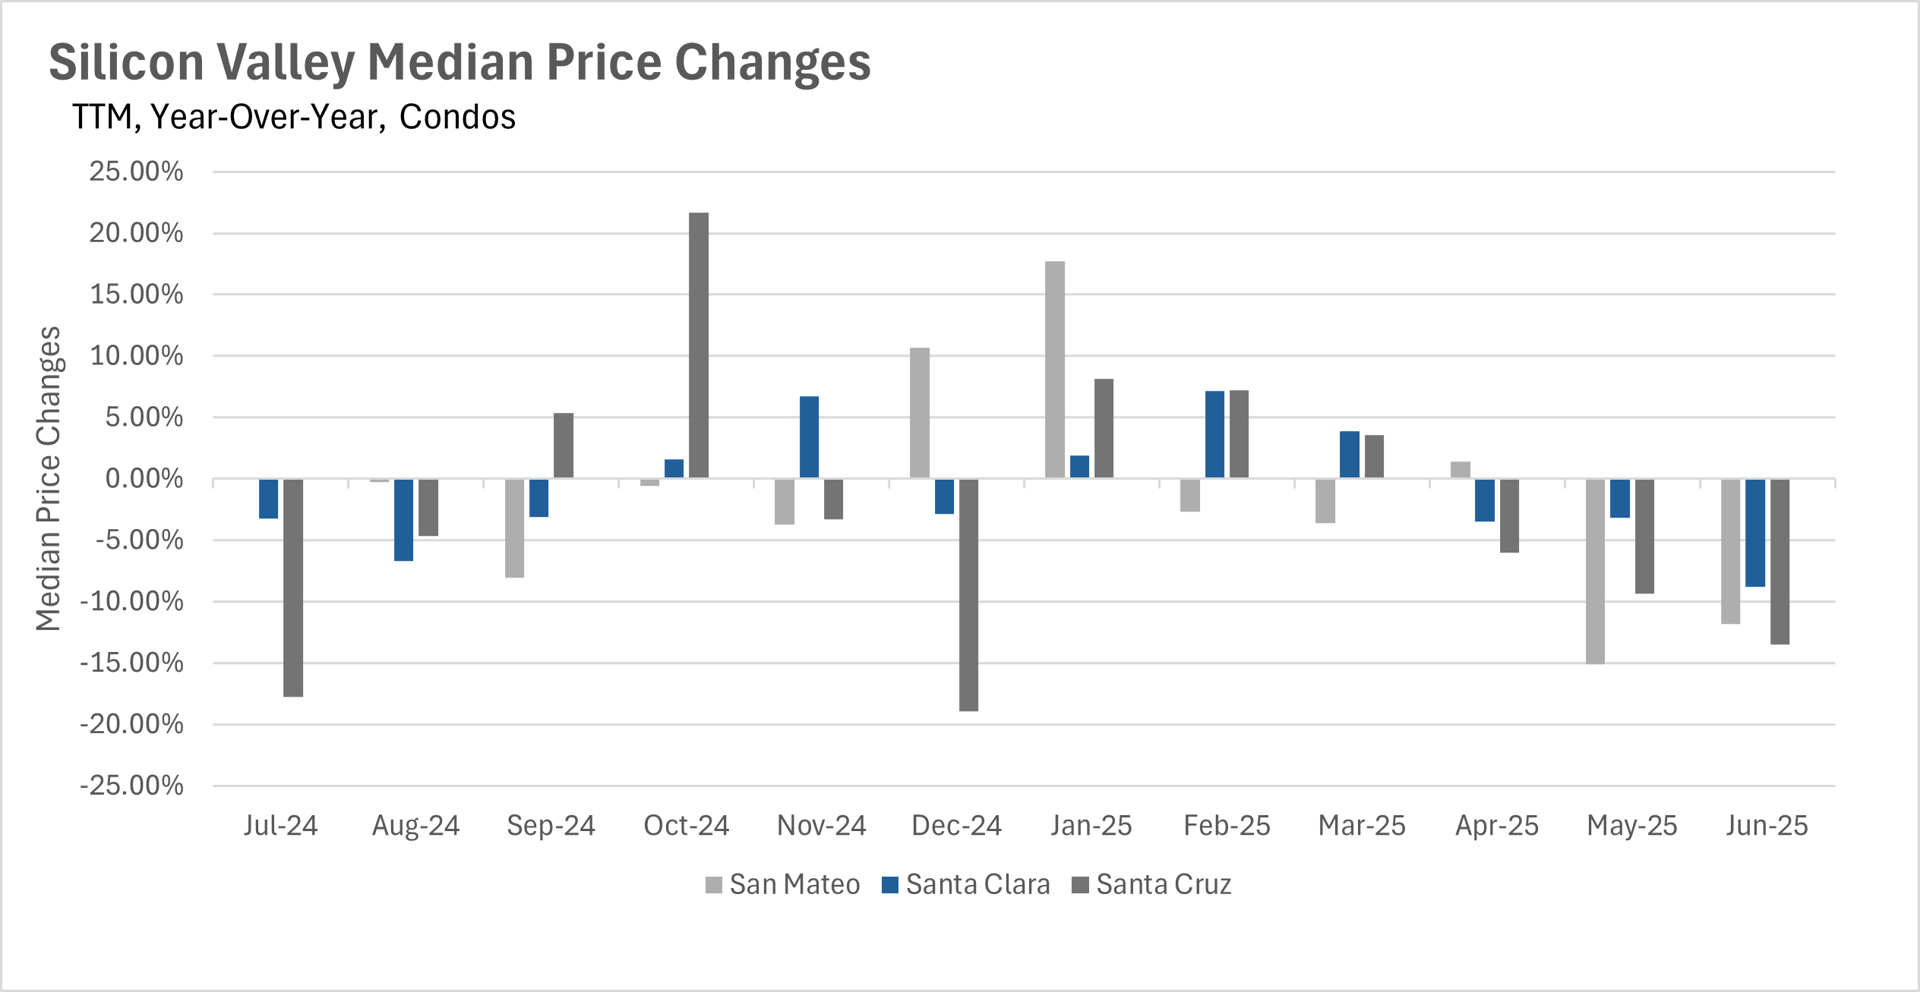
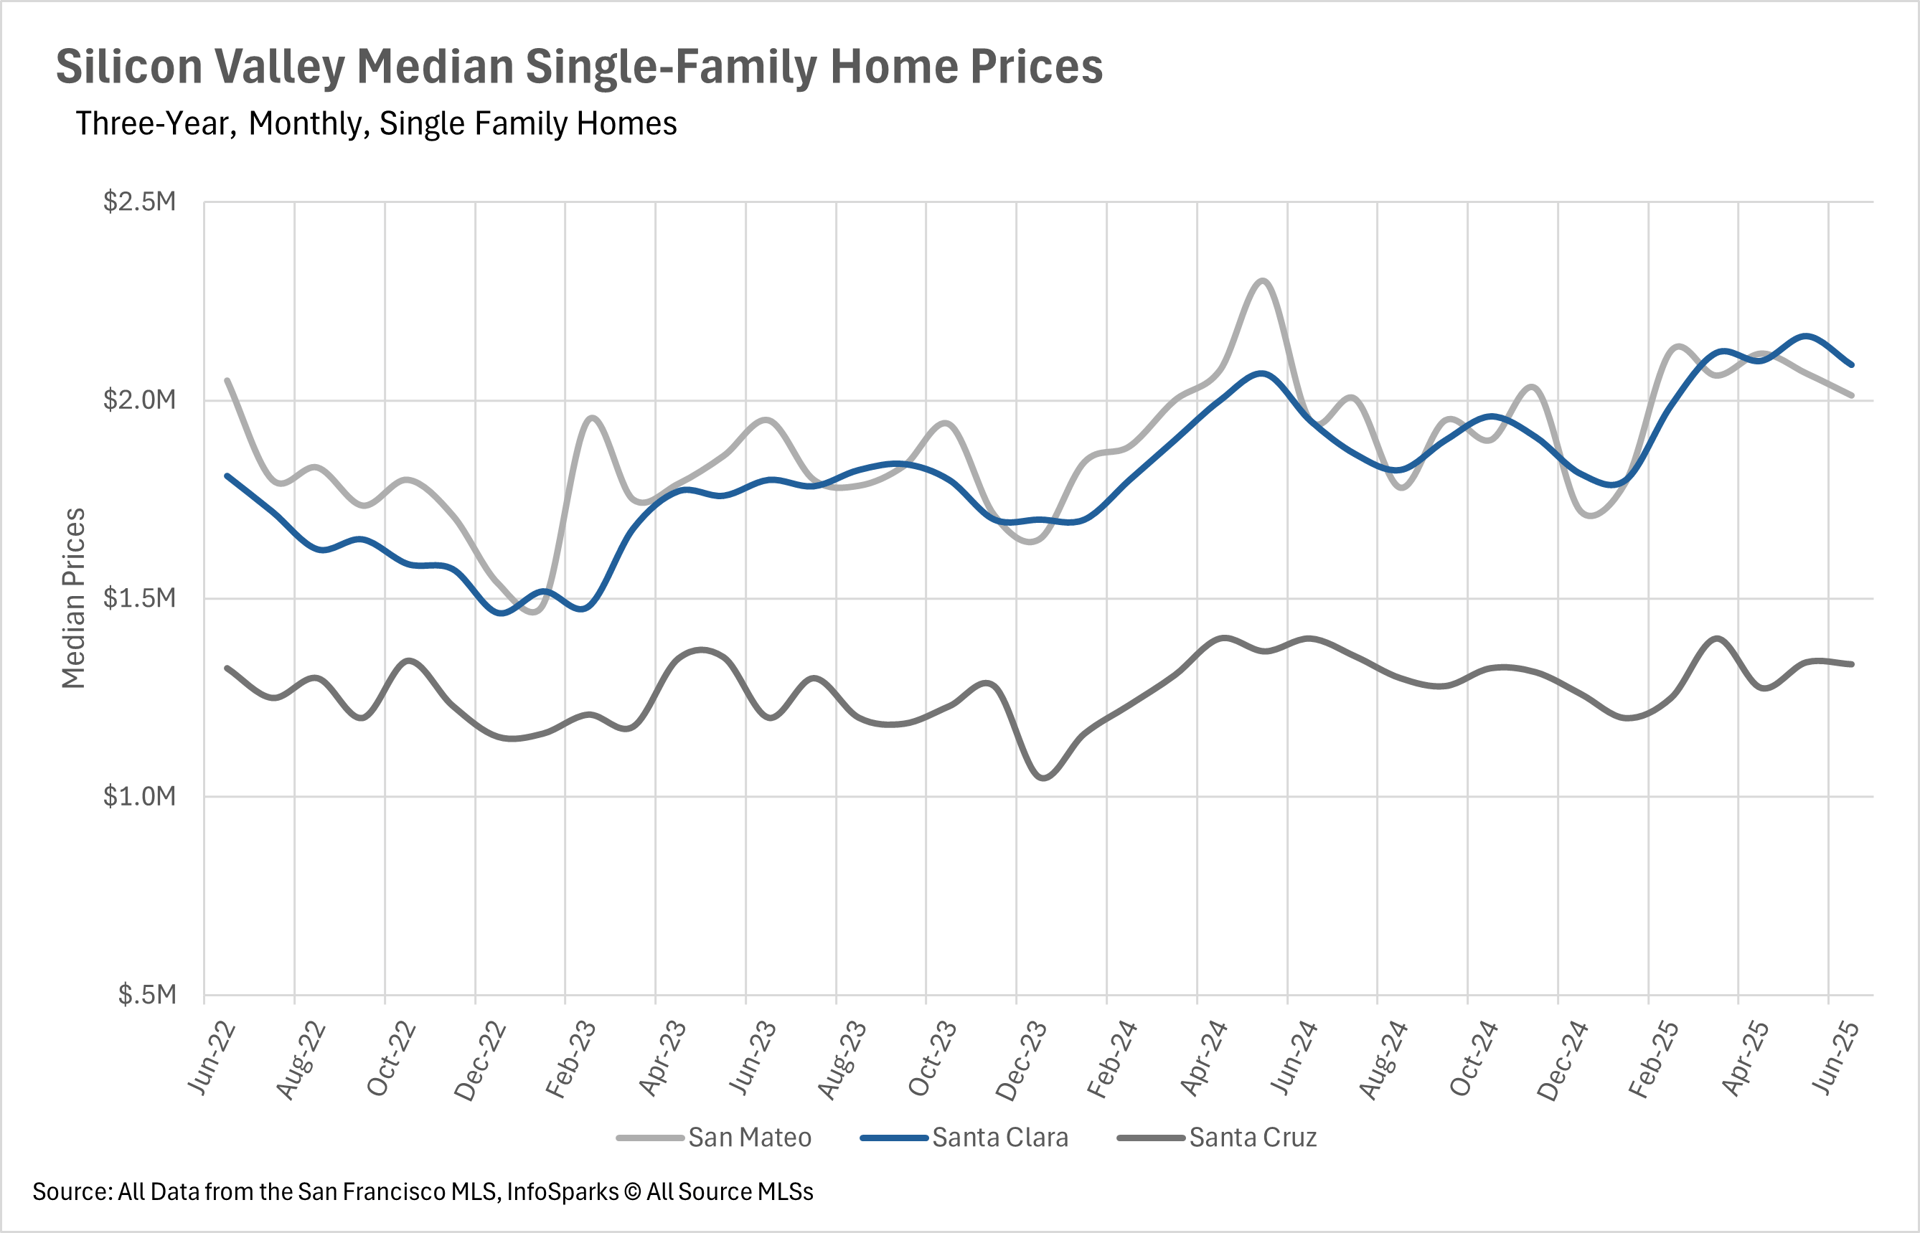
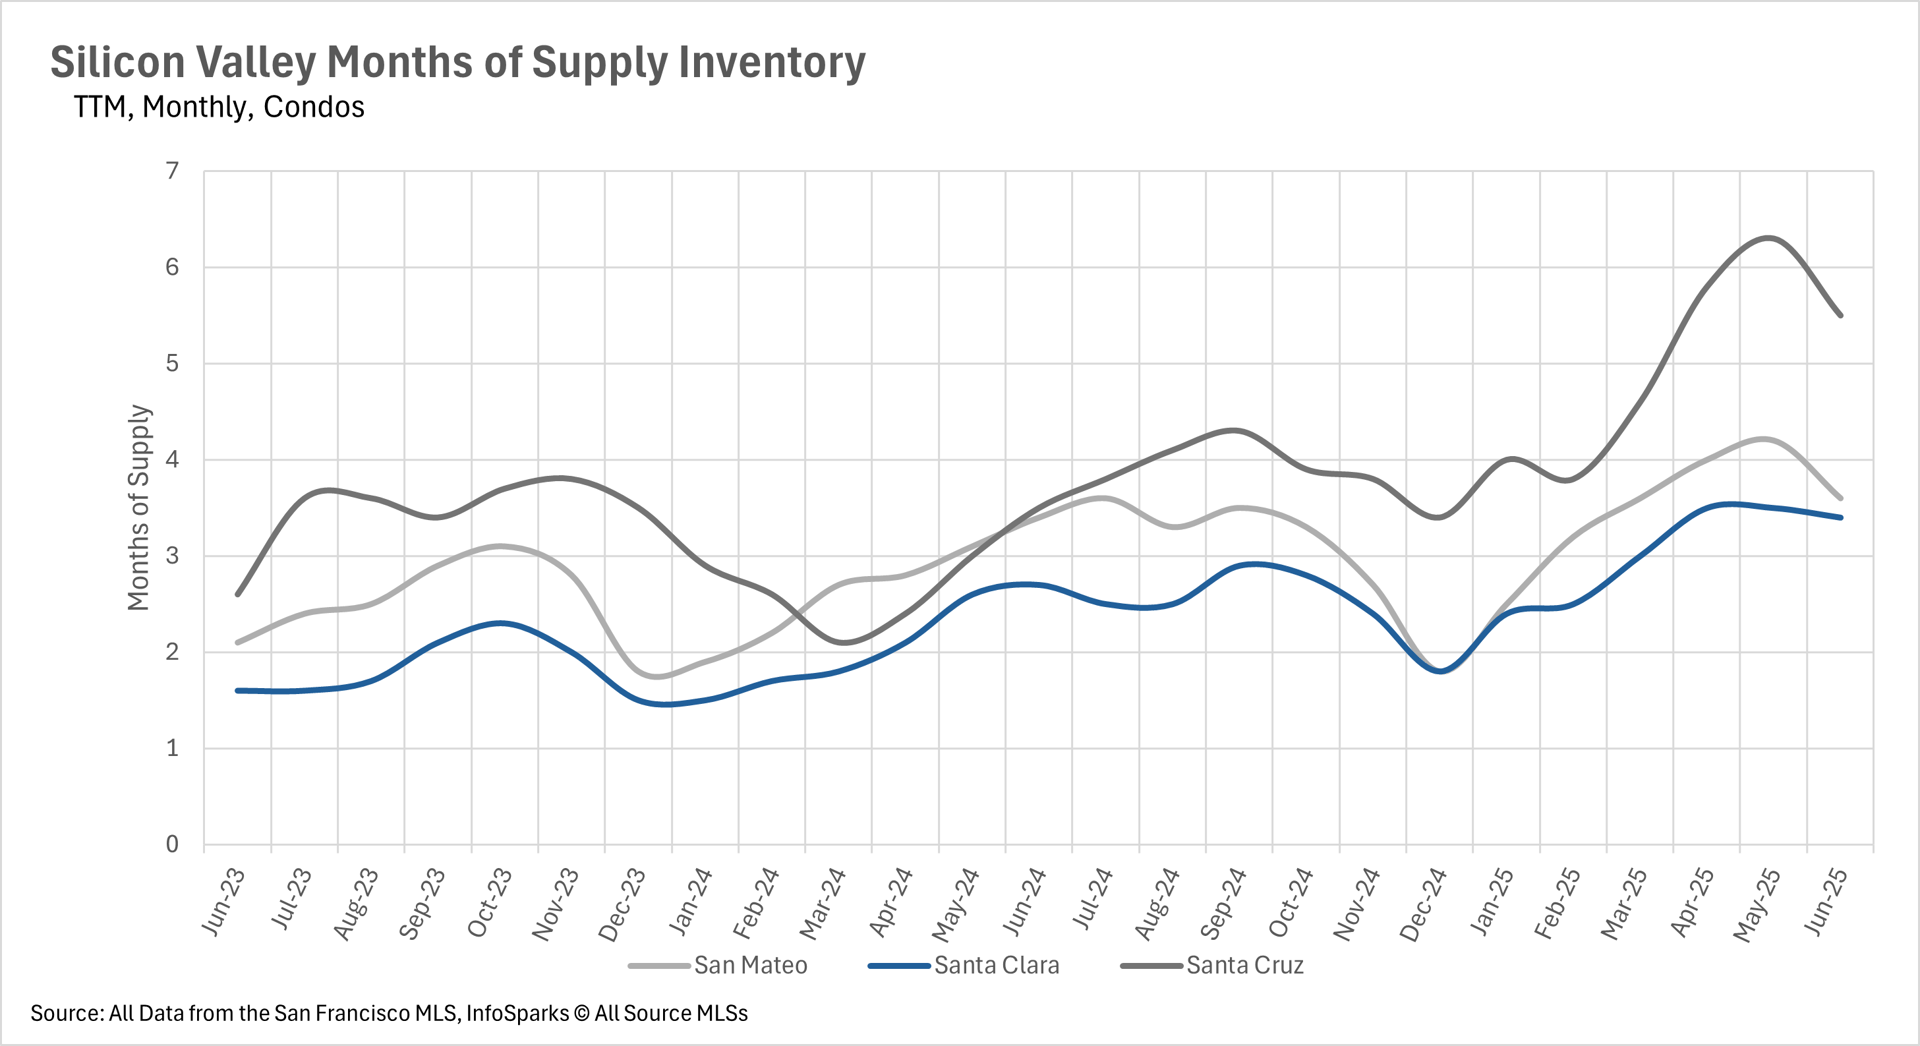
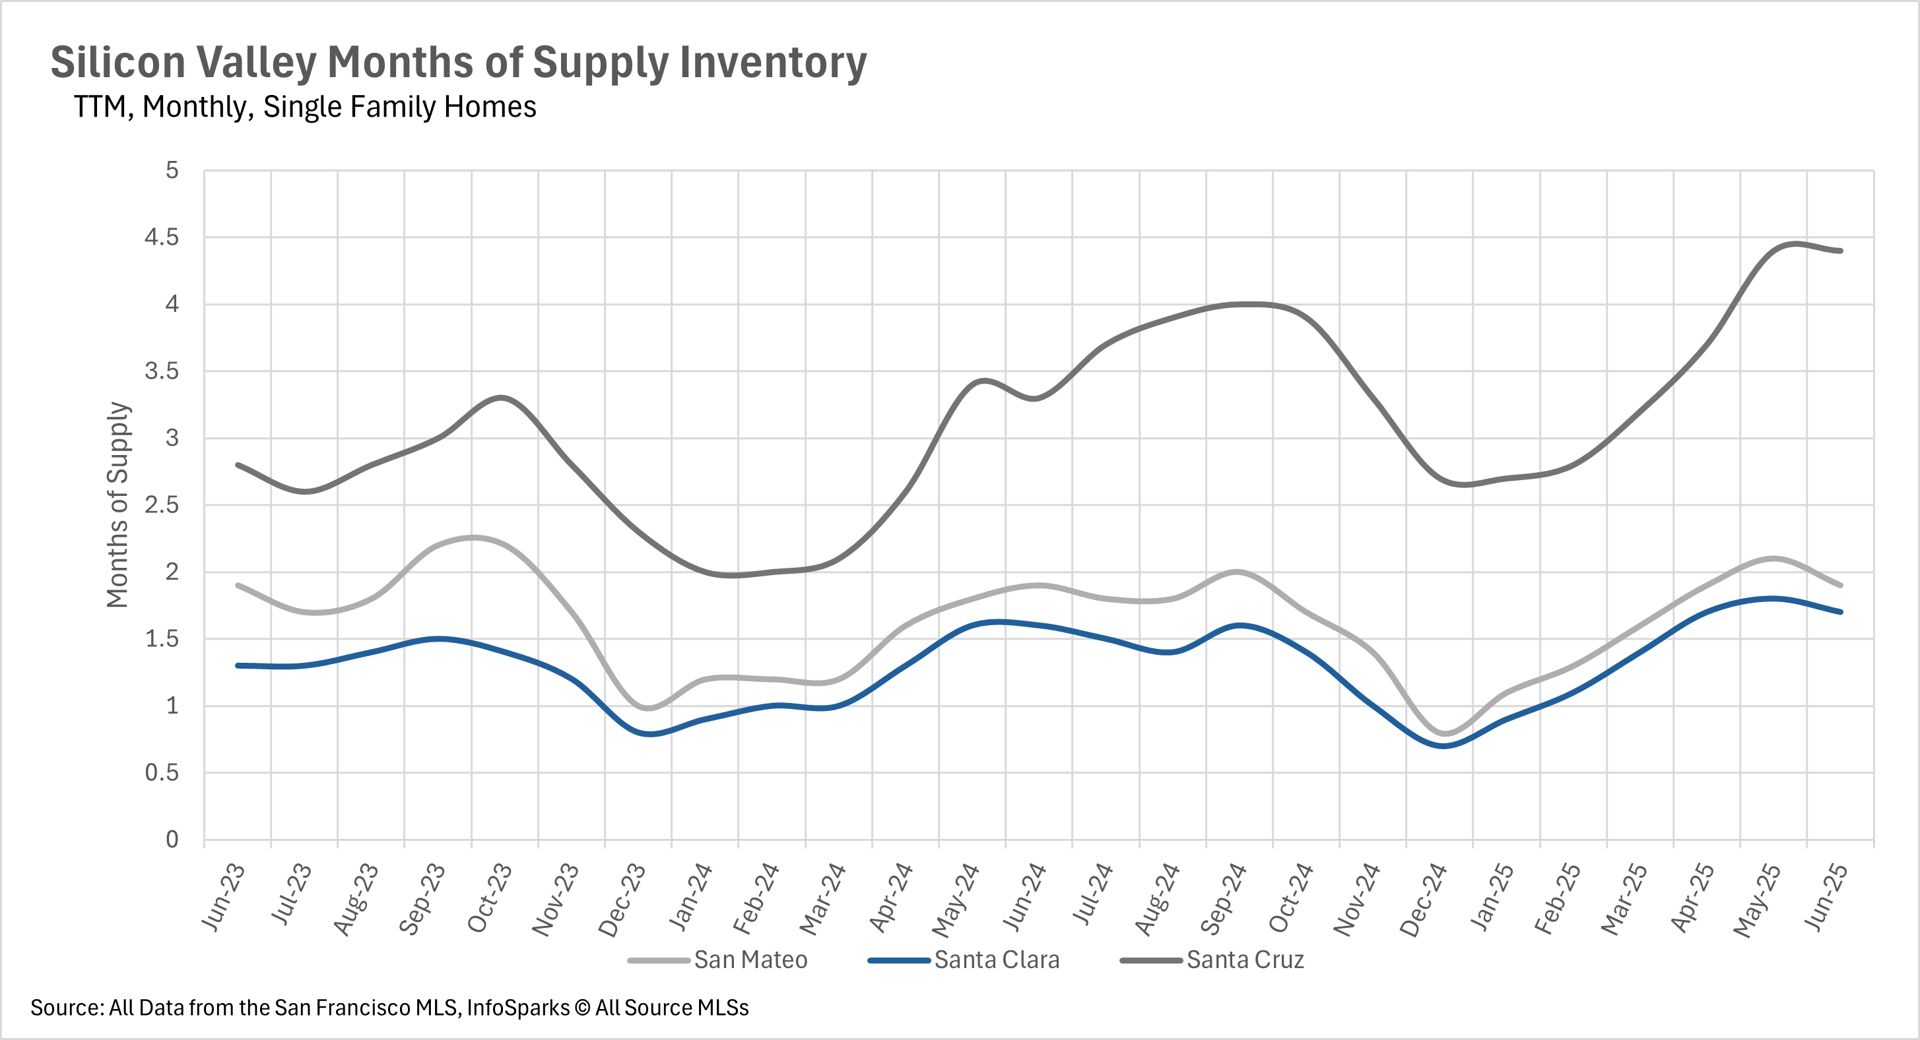
The single-family home market remains an incredibly competitive market, with average listings in San Mateo, Santa Clara, and Santa Cruz counties being snapped up in 13, 11, and 17 days, respectively.  However, condos are spending considerably more time on the market, with the average listing in San Mateo County spending 39 days on the market (a 116.67% increase year-over-year).  Additionally, the average listings in Santa Clara and Santa Cruz Counties are spending 22 and 38 days on the market, representing 83.33% and 245.45% year-over-year increases!


The Silicon Valley single-family home market remains incredibly competitive

When determining whether a market is a buyers’ market or a sellers’ market, we look to the Months of Supply Inventory (MSI) metric.  The state of California has historically averaged around three months of MSI, so any area with at or around three months of MSI is considered a balanced market.  Any market that has lower than three months of MSI is considered a seller’s market, whereas markets with more than three months of MSI are considered buyers’ markets.
 
As you might expect, the single-family home market is pretty competitive, with San Mateo and Santa Clara Counties being sellers’ markets, with just 1.9 months and 1.7 months worth of inventory on the market, respectively.  Whereas, Santa Cruz County is a buyer's market, with 4.4 months' worth of inventory on the market.  On the other hand, the condo market is entirely a buyers' market, with 3.6 months, 3.4 months, and 5.5 months worth of inventory on the market in San Mateo, Santa Clara, and Santa Cruz Counties, respectively.  
 

Local Lowdown Data

Let’s Talk

You’ve got questions and we can’t wait to answer them.

Follow Us on Instagram