Silicon Valley Real Estate Market Update: June 2025 Insights and Analysis
Kevin Swartz | June 17, 2025
Silicon Valley

Kevin Swartz | June 17, 2025
Silicon Valley
Quick Take:
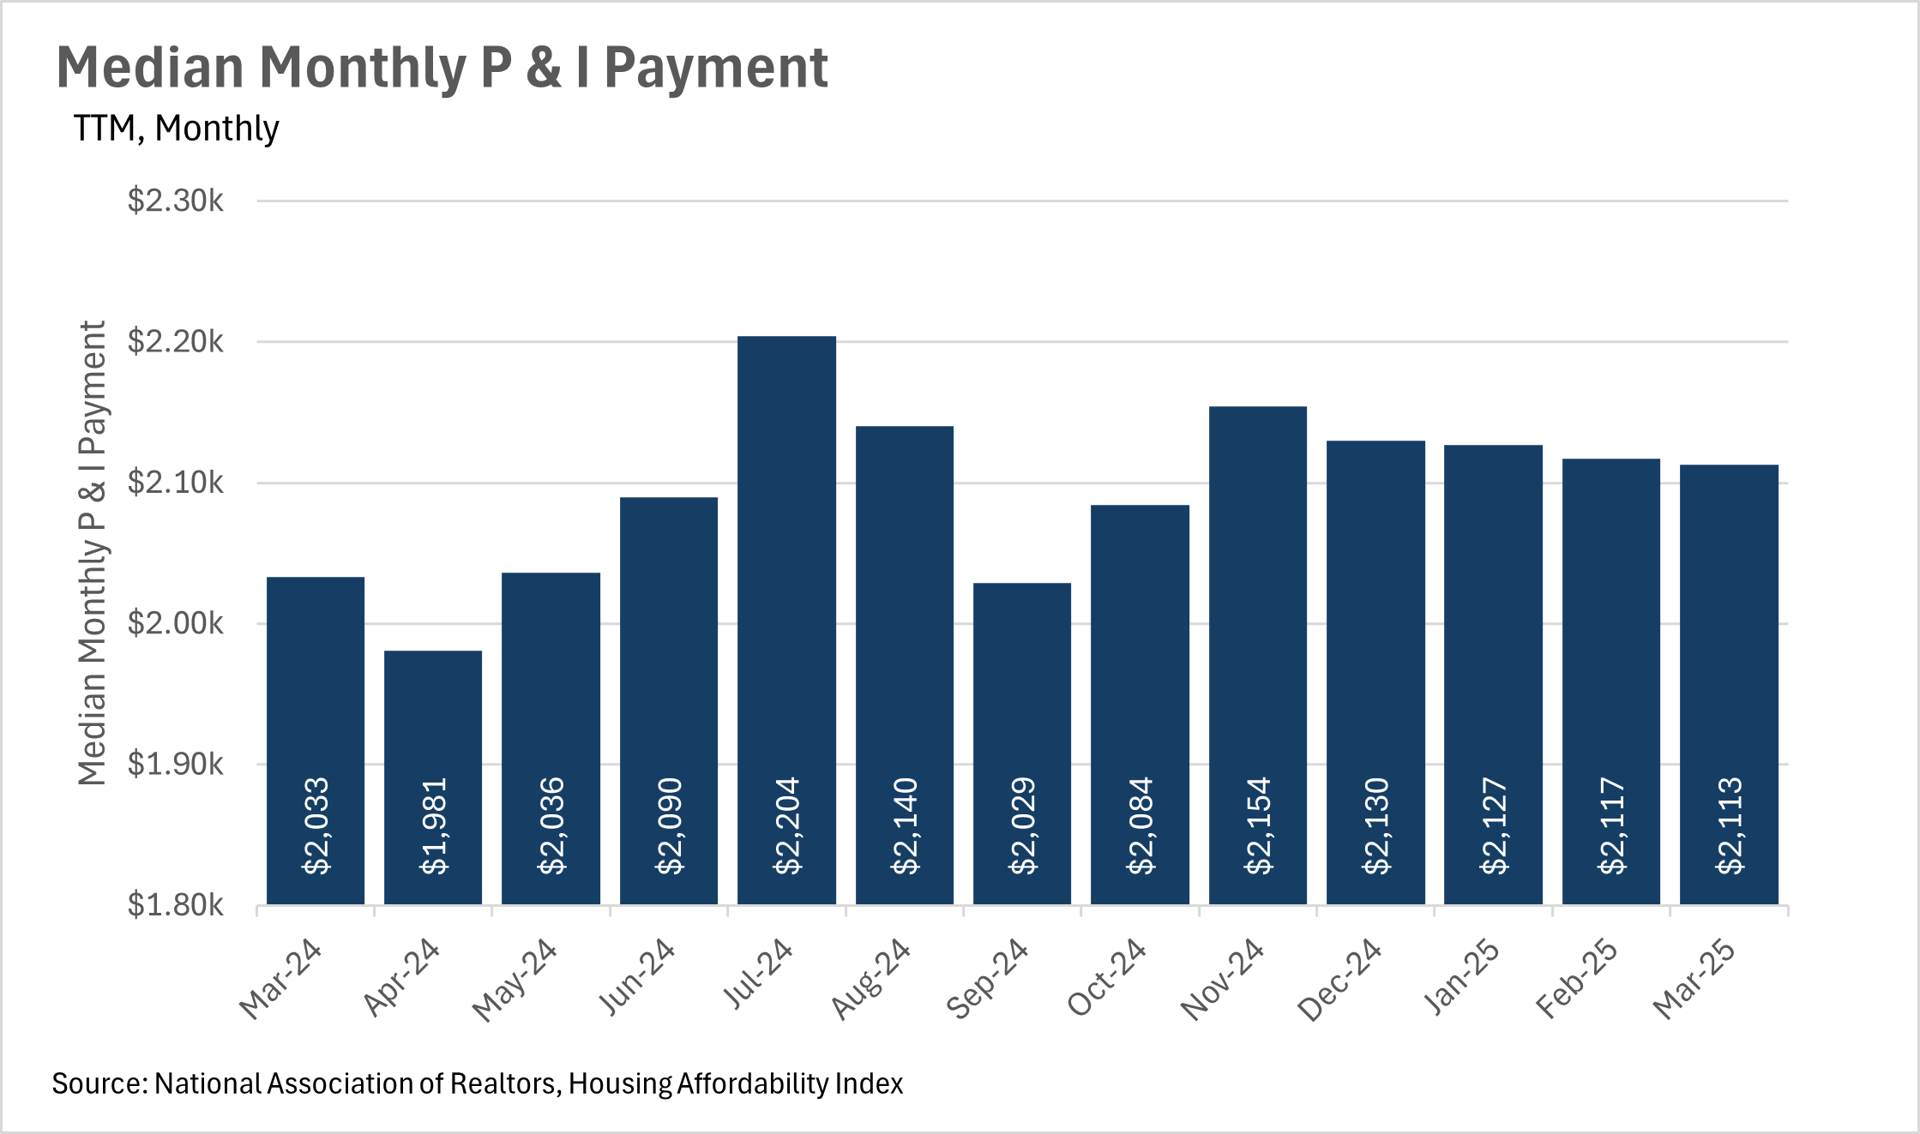
For quite some time, we’ve seen monthly inflation readouts with figures in the 2-3% range. Despite the fact that inflation seems to be under wraps for now, the median monthly P&I payment has grown faster than inflation, with the most reading coming in at $2,113, representing a 3.94% increase on a year-over-year basis. This shows that there are still inflationary pressures at work in the housing market.
Factors contributing to this inflation will vary by market. Some markets have more of an issue on the supply side (i.e. higher construction/materials costs), while others have an issue with the demand side (i.e. more demand for homes than supply). It will be especially important to pay attention to this metric over the coming months to get a gauge of how inflation is impacting the housing market.
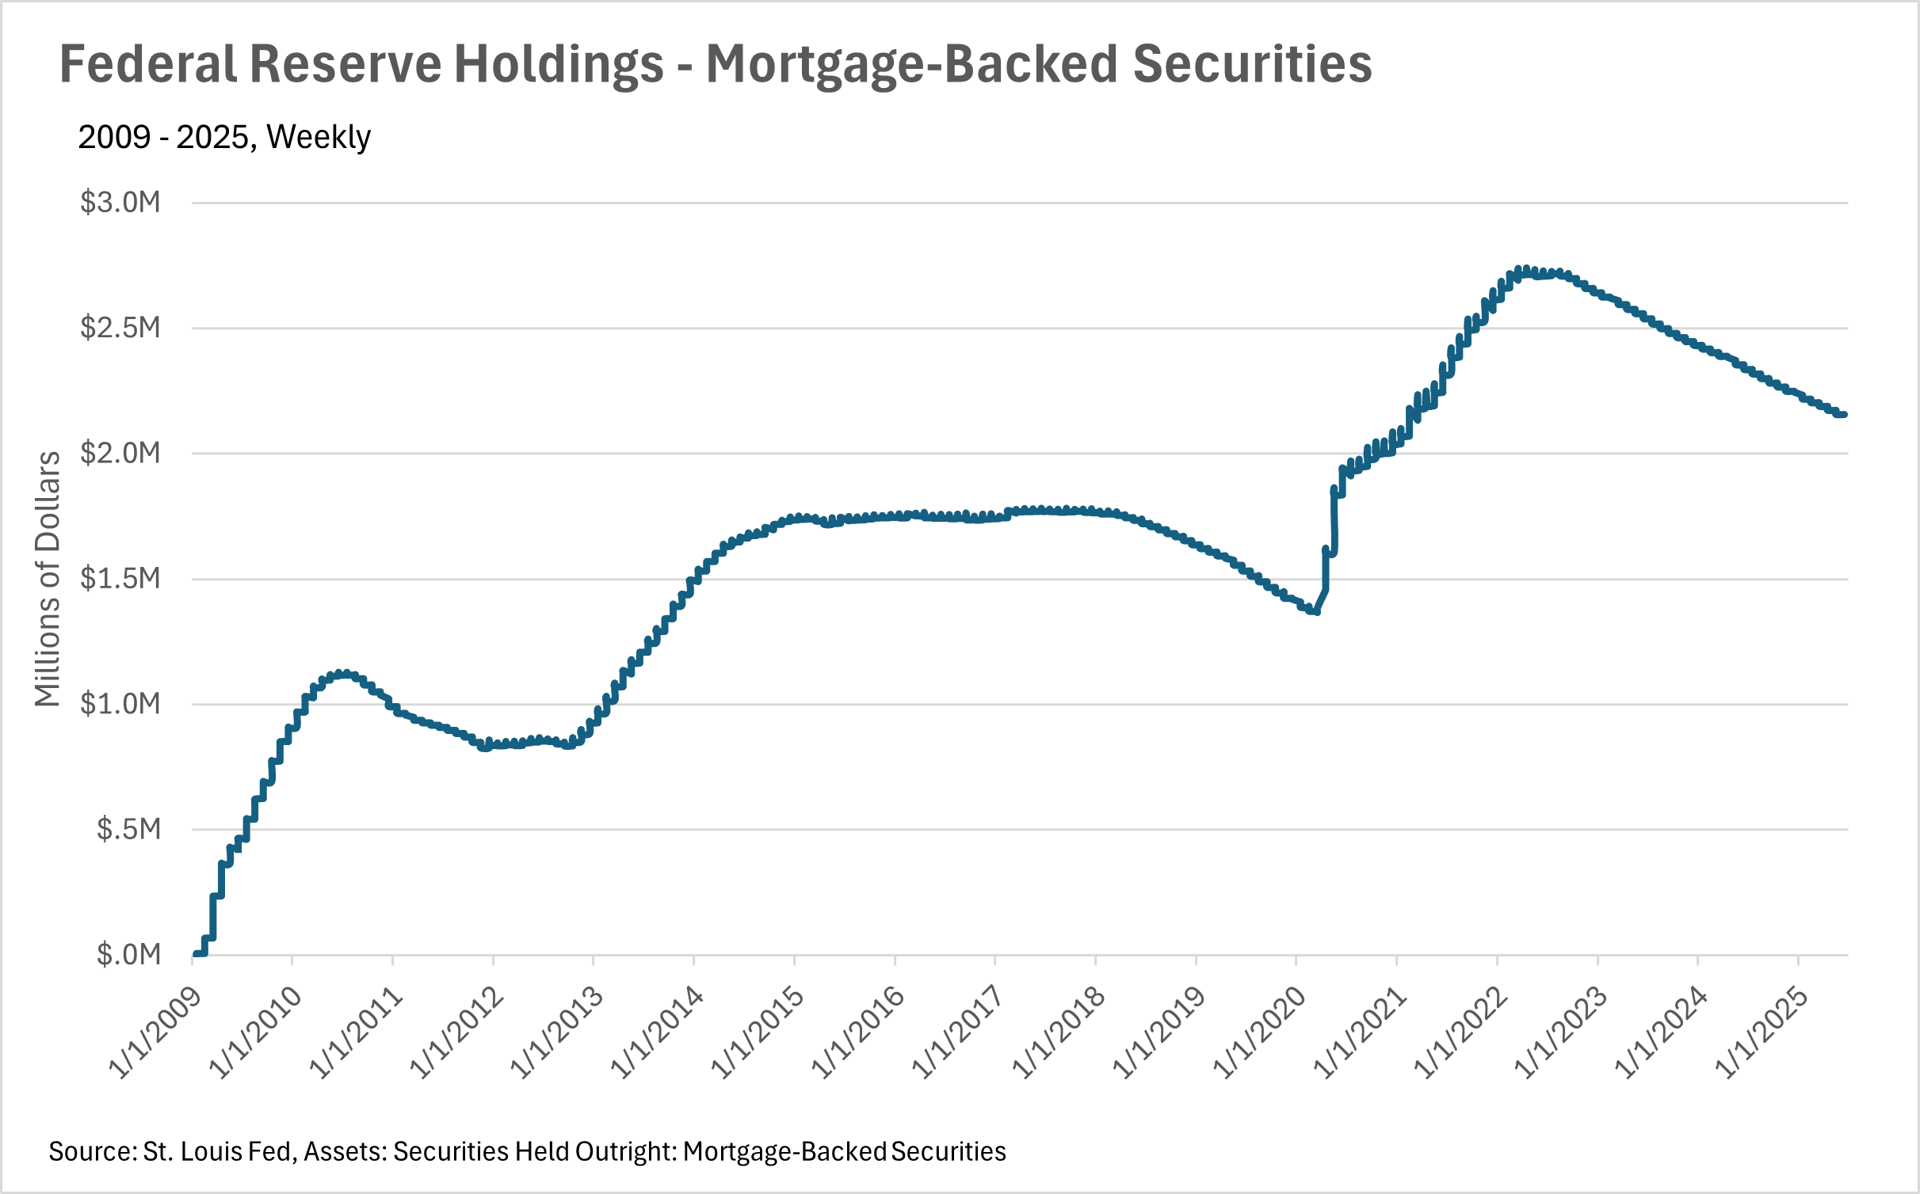
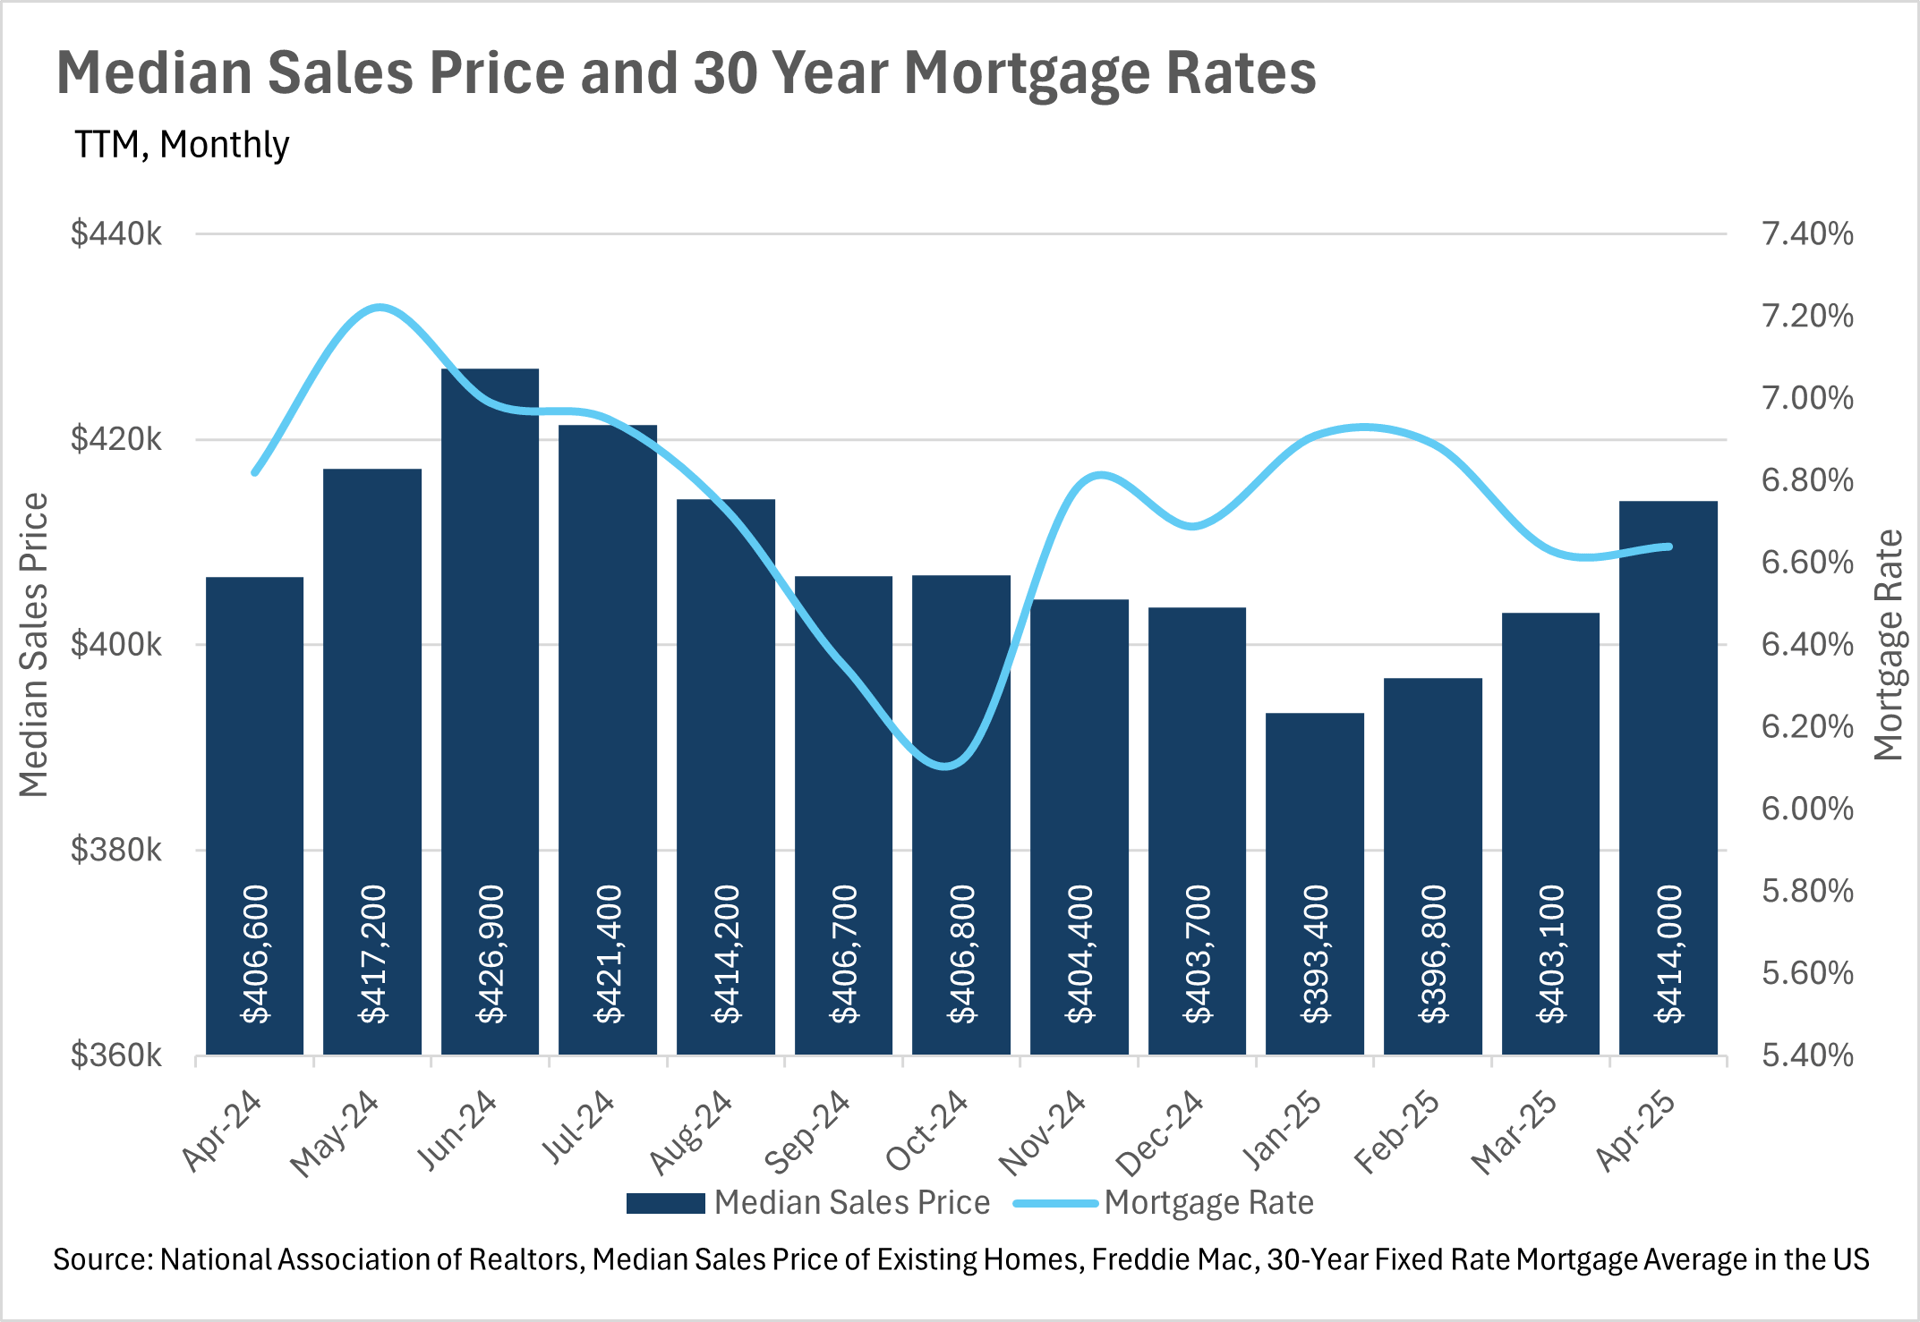
Mortgage rates have remained high, in the mid to high-6% range for quite some time. Some believe that the recent trade war was being implemented in part to bring down interest rates. However, judging by recent commentary from the Fed, the trade war and the associated uncertainty, has only made Fed officials more cautious in utilizing the incredibly powerful economic tool that is the federal funds rate.
This means that we are probably going to see elevated mortgage rates for the foreseeable future, unless the economy takes a considerable turn for the worse. It is worth noting though, that according to the Fed’s “Dot Plot”, the majority of Federal Reserve officials predict the federal funds rate will be in the 3.75-4.00% range by the end of the year, and the 3.25-3.50% range in 2026.
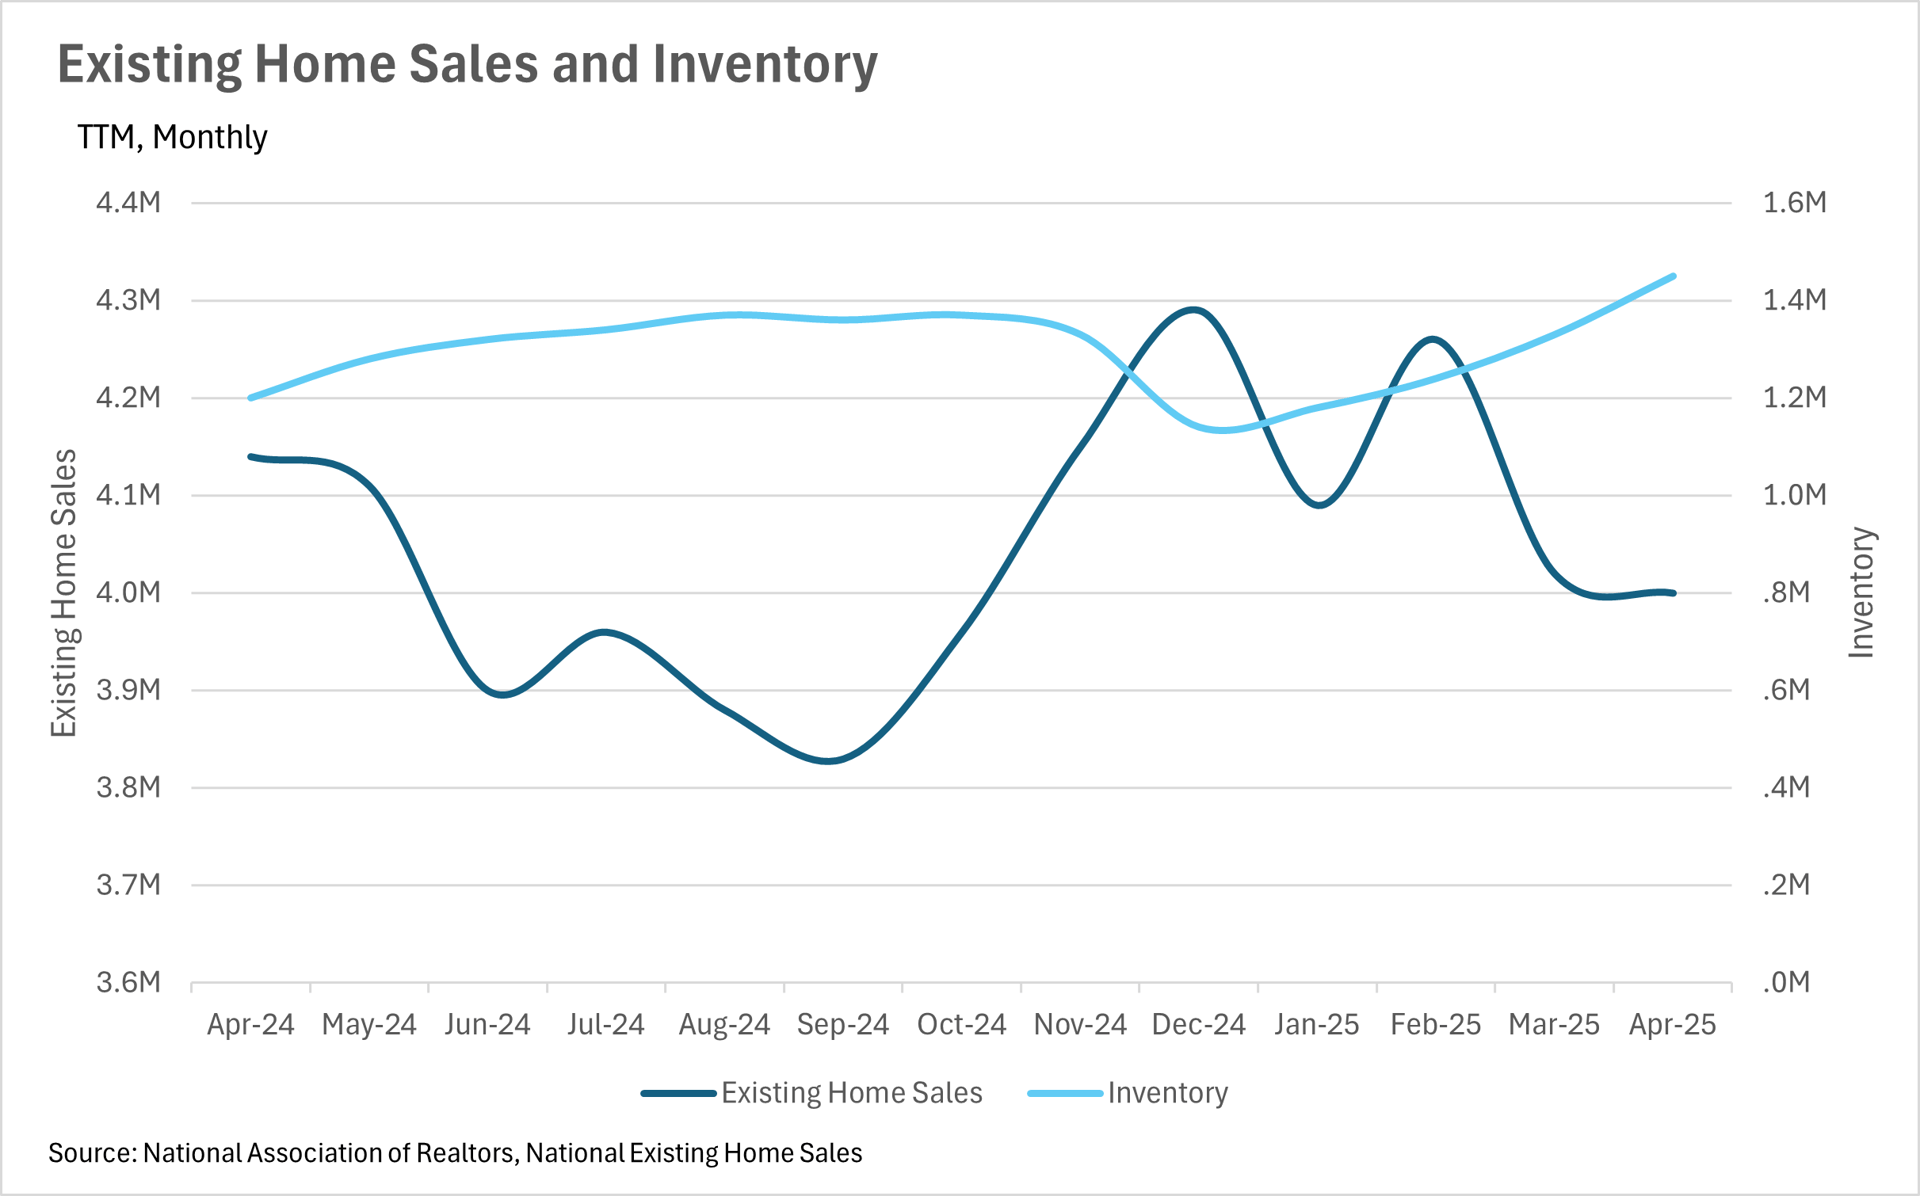
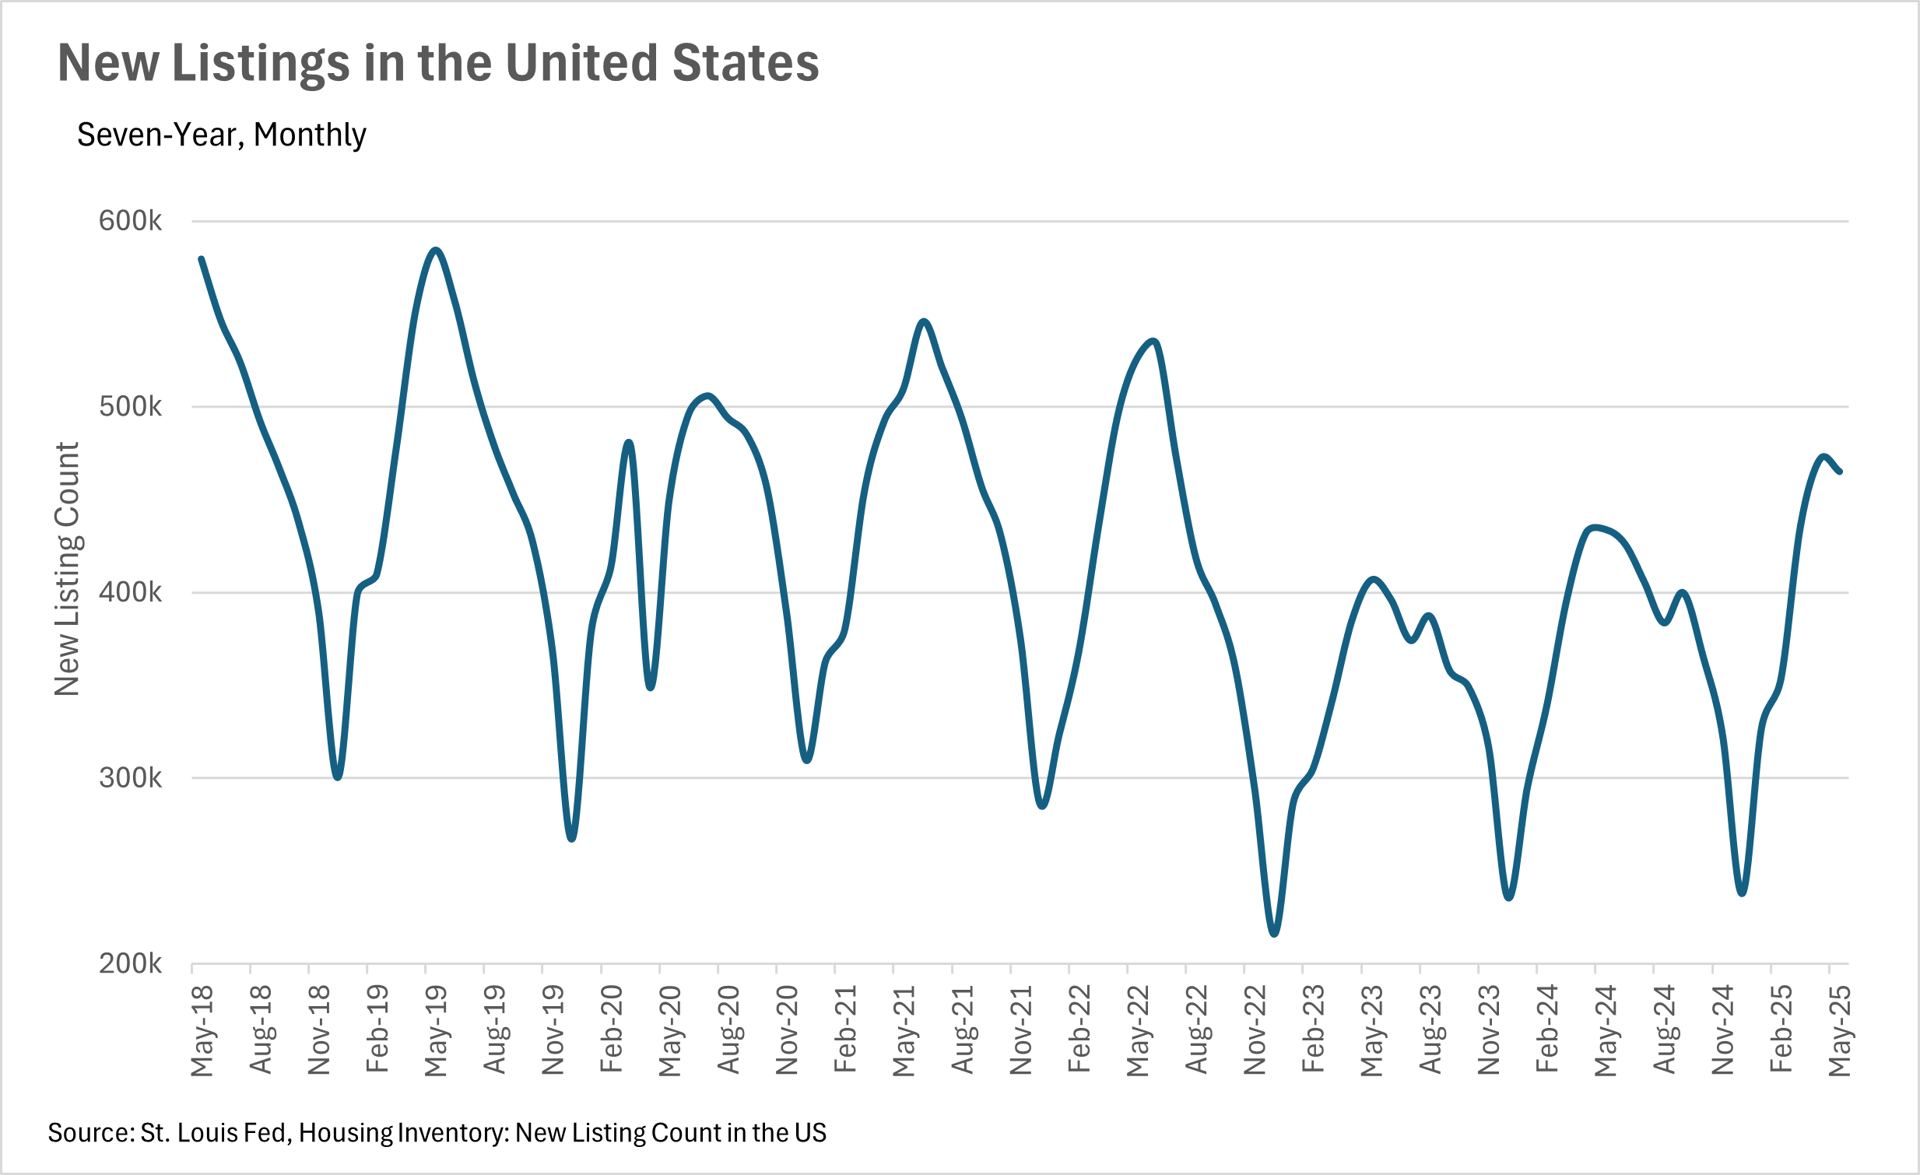
The moves in sales and inventory that we’ve been seeing throughout California over the past few months have been echoed on a national scale. The nation as a whole has seen inventories build, as homes sit on the market for longer. Our most recent data point (April 2025), shows that inventory increased by 20.83% on a year-over-year basis, to 1,450,000. Meanwhile, existing home sales decreased by 3.38%, to 4,000,000.
Despite the growing backlog of inventory, median sale prices are still trending upward, with the median listing selling for $414,000, representing a 1.82% year-over-year increase. To add fuel to the fire, we’ve seen growing numbers of listings hitting the market, with the number of new listings hitting the market increasing by 7.19% on a year-over-year basis.
Ultimately though, this is just what we’re seeing at a national level. As we all know, real estate is an incredibly localized industry, so knowing what’s going on in your own market is pivotal. Below is our local lowdown, that outlines everything you need to know about what’s happening around you in your neighborhood and surrounding areas!
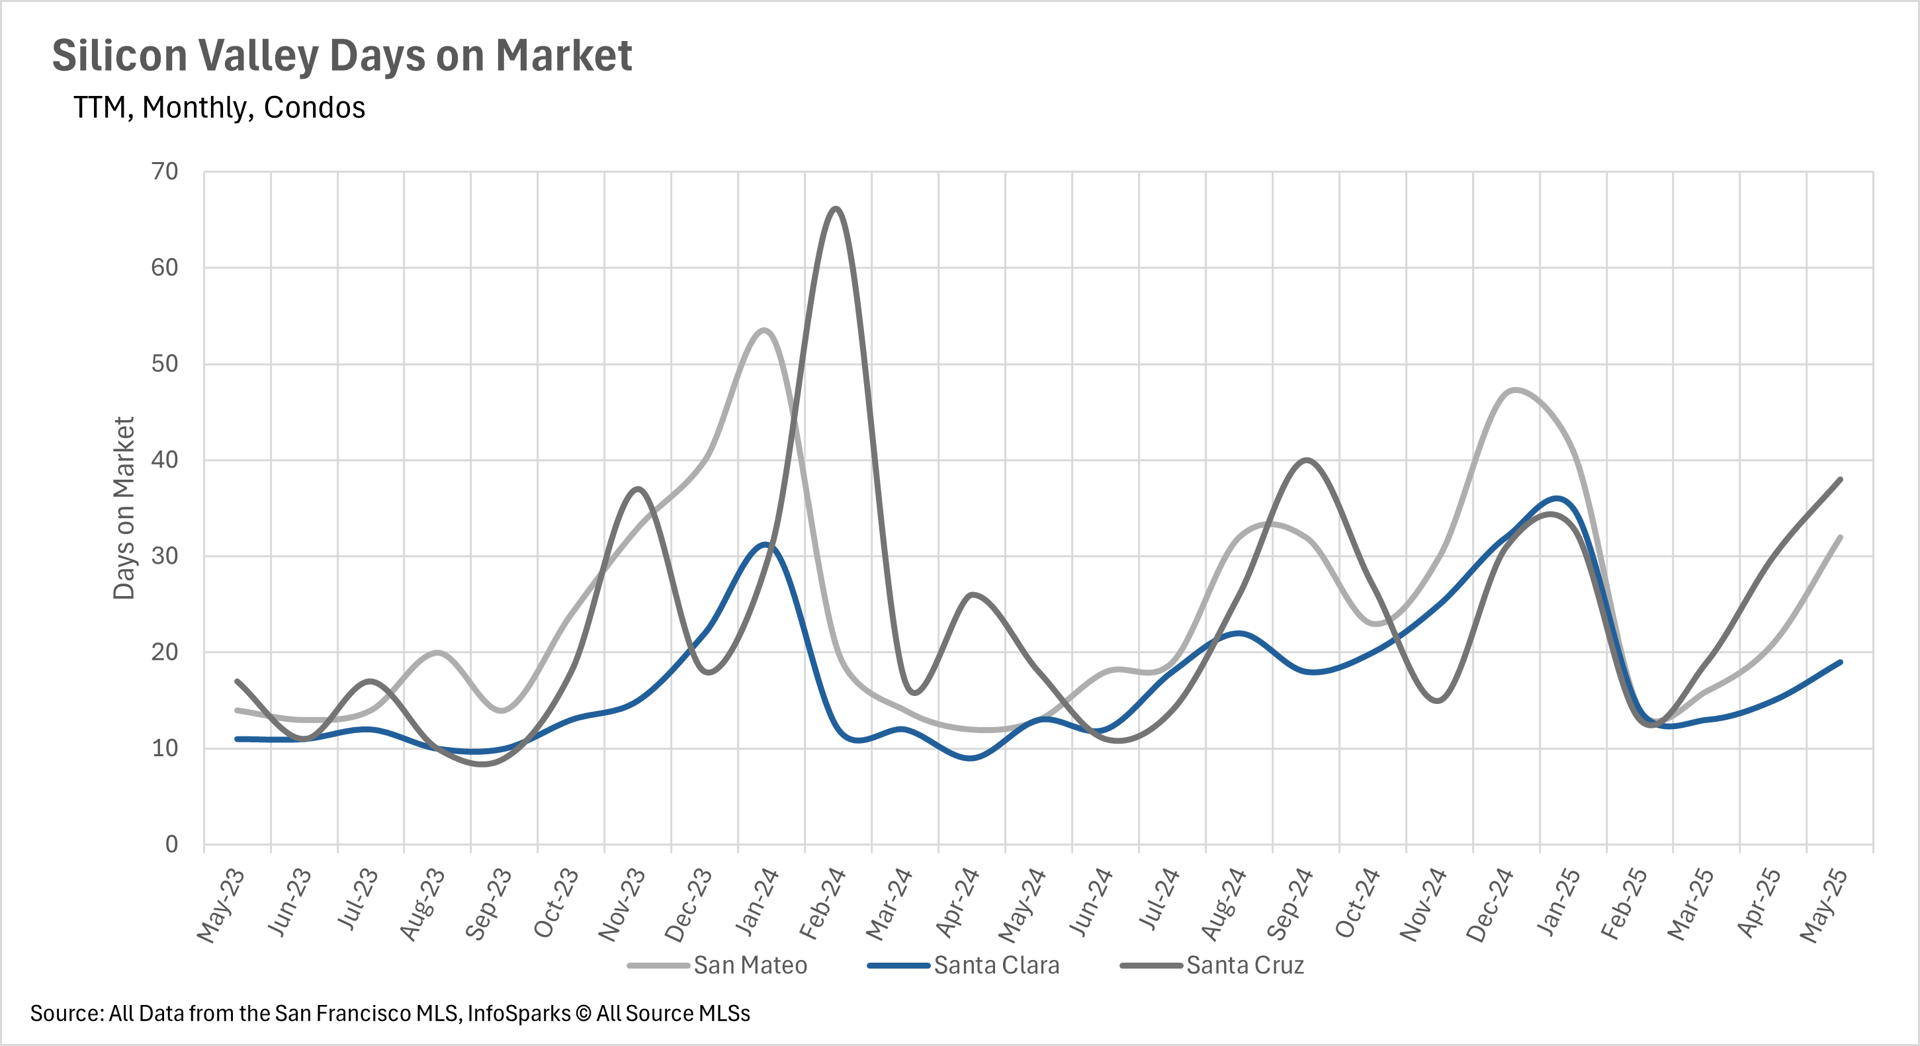
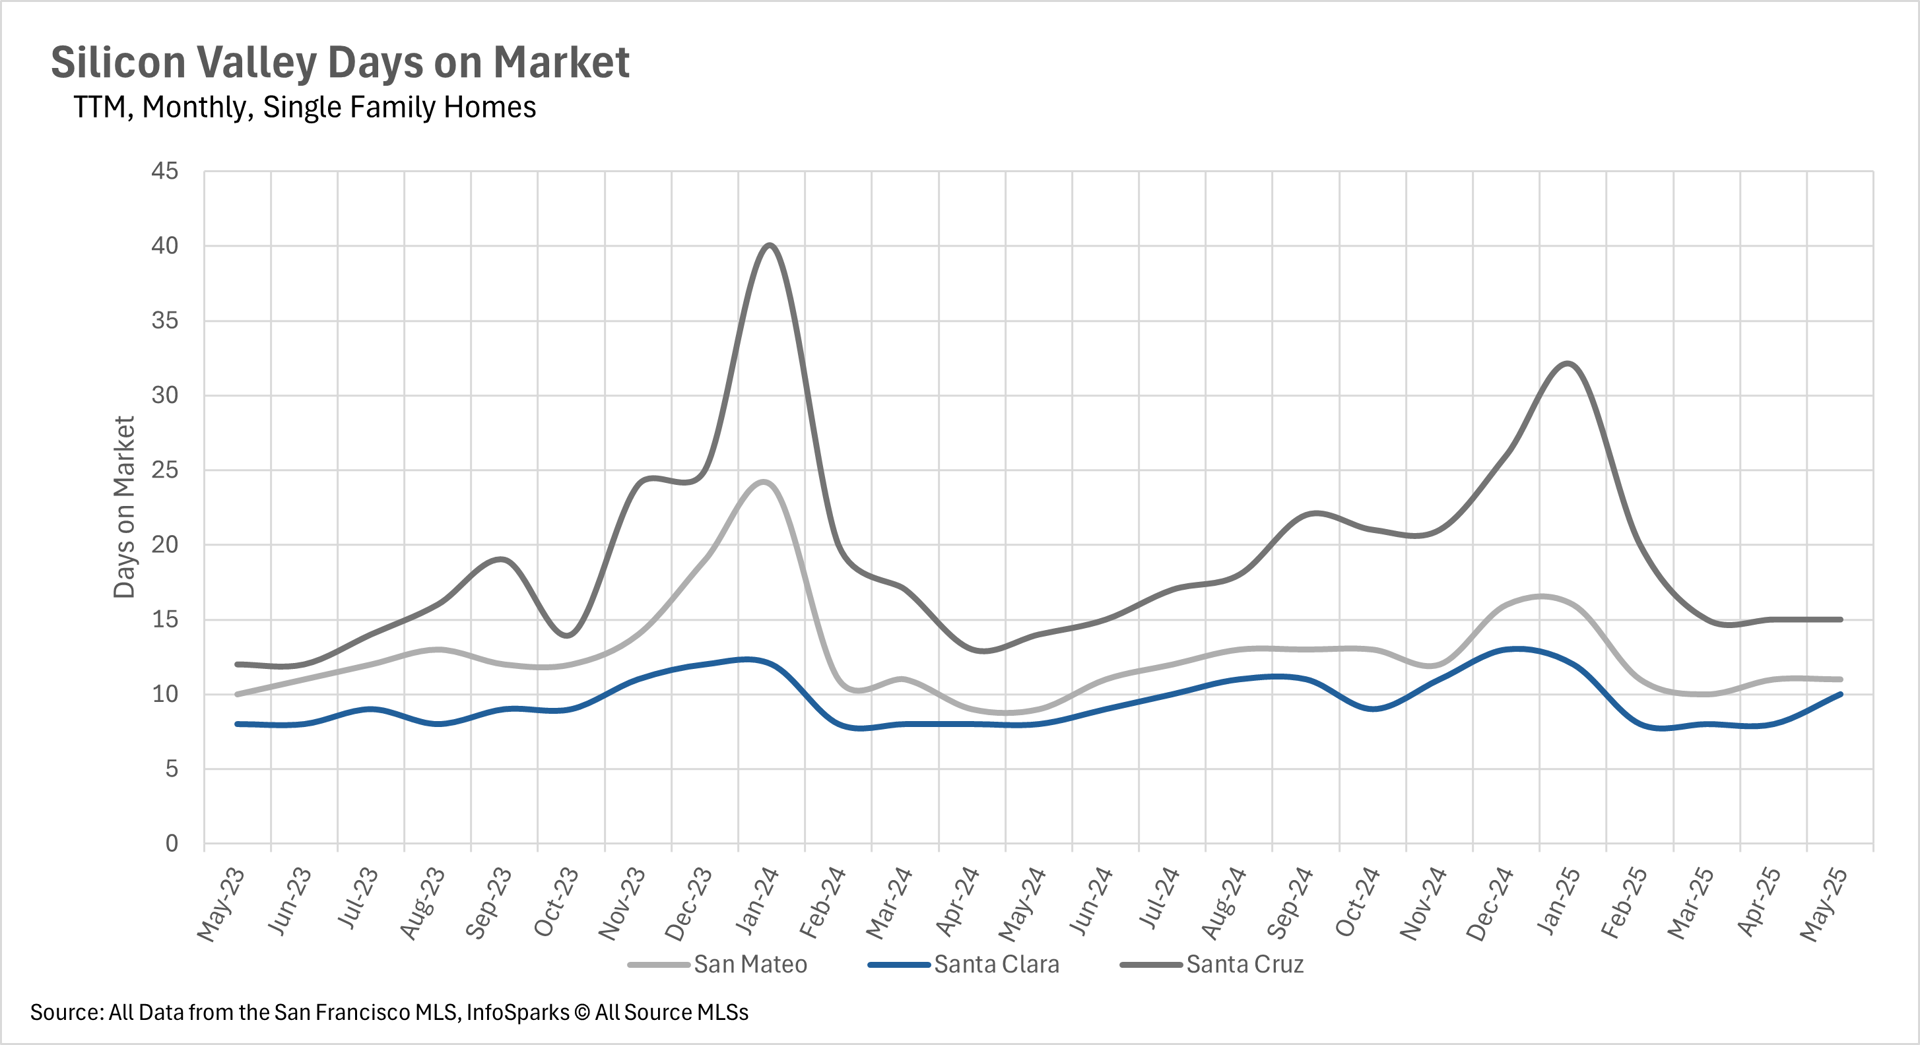
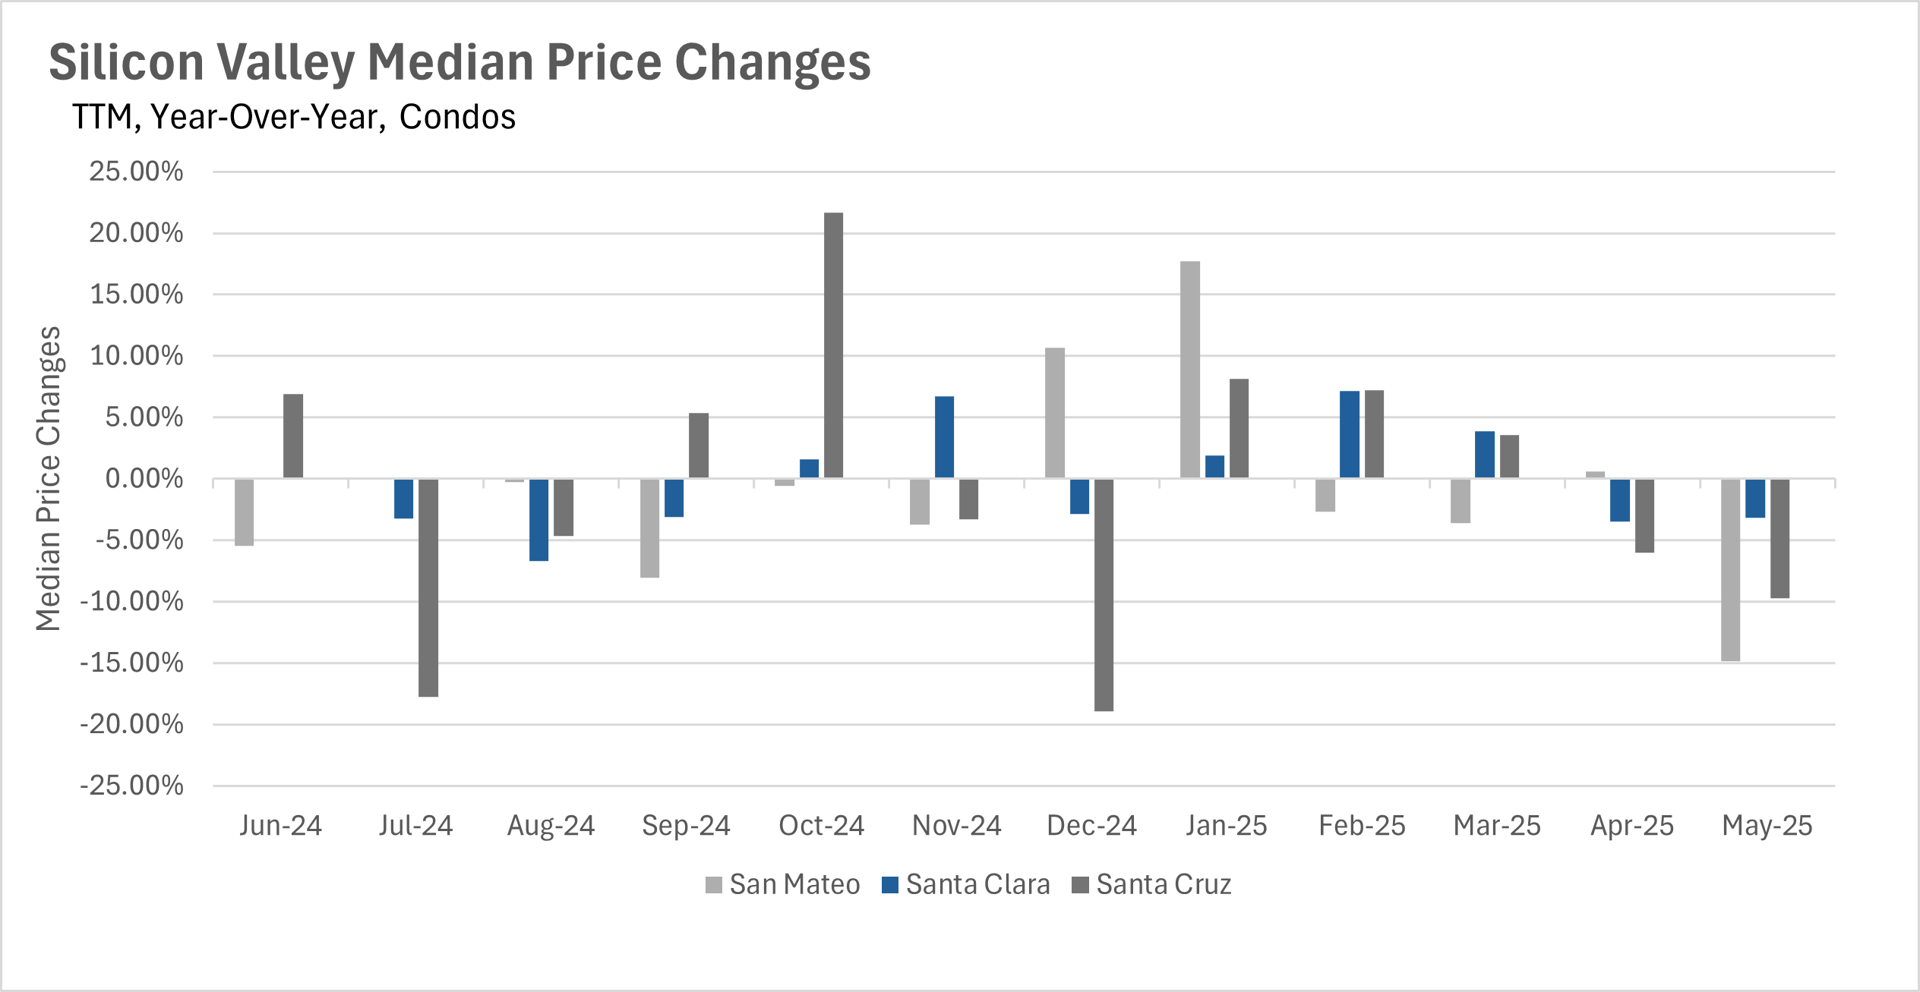
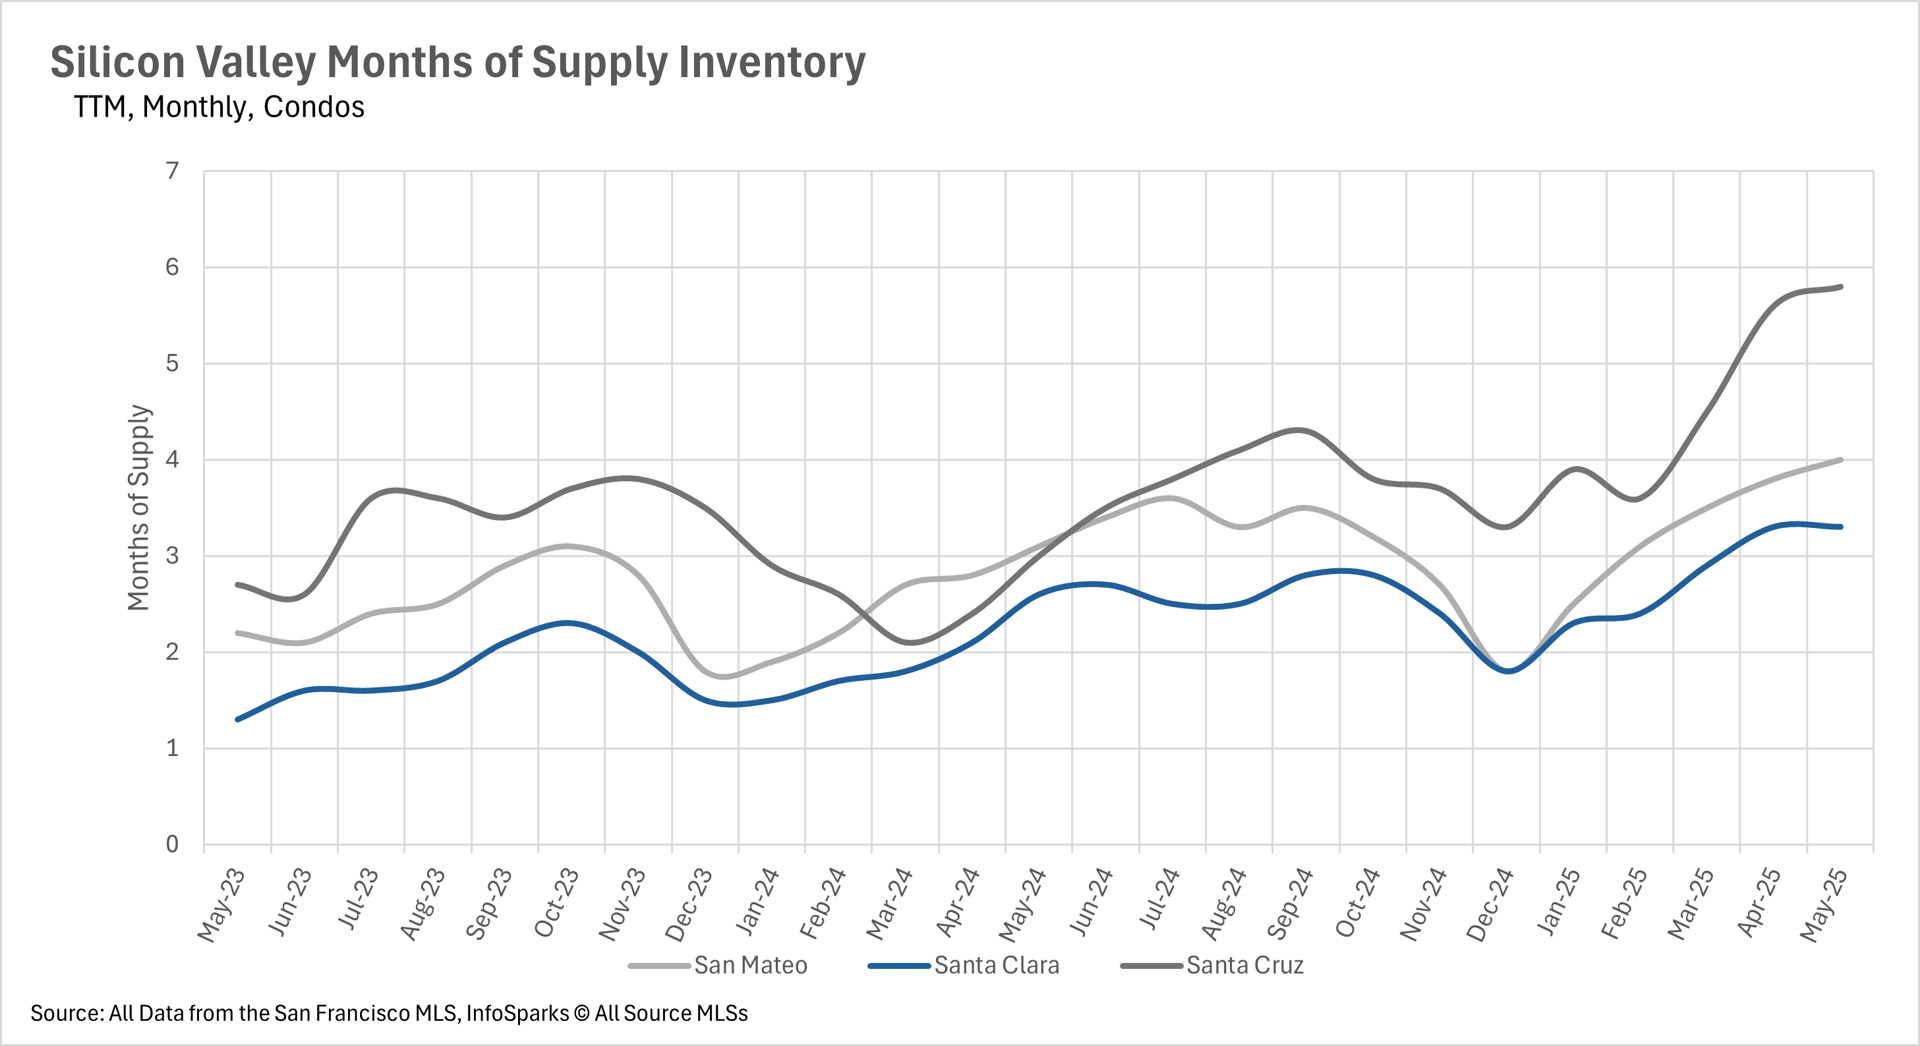
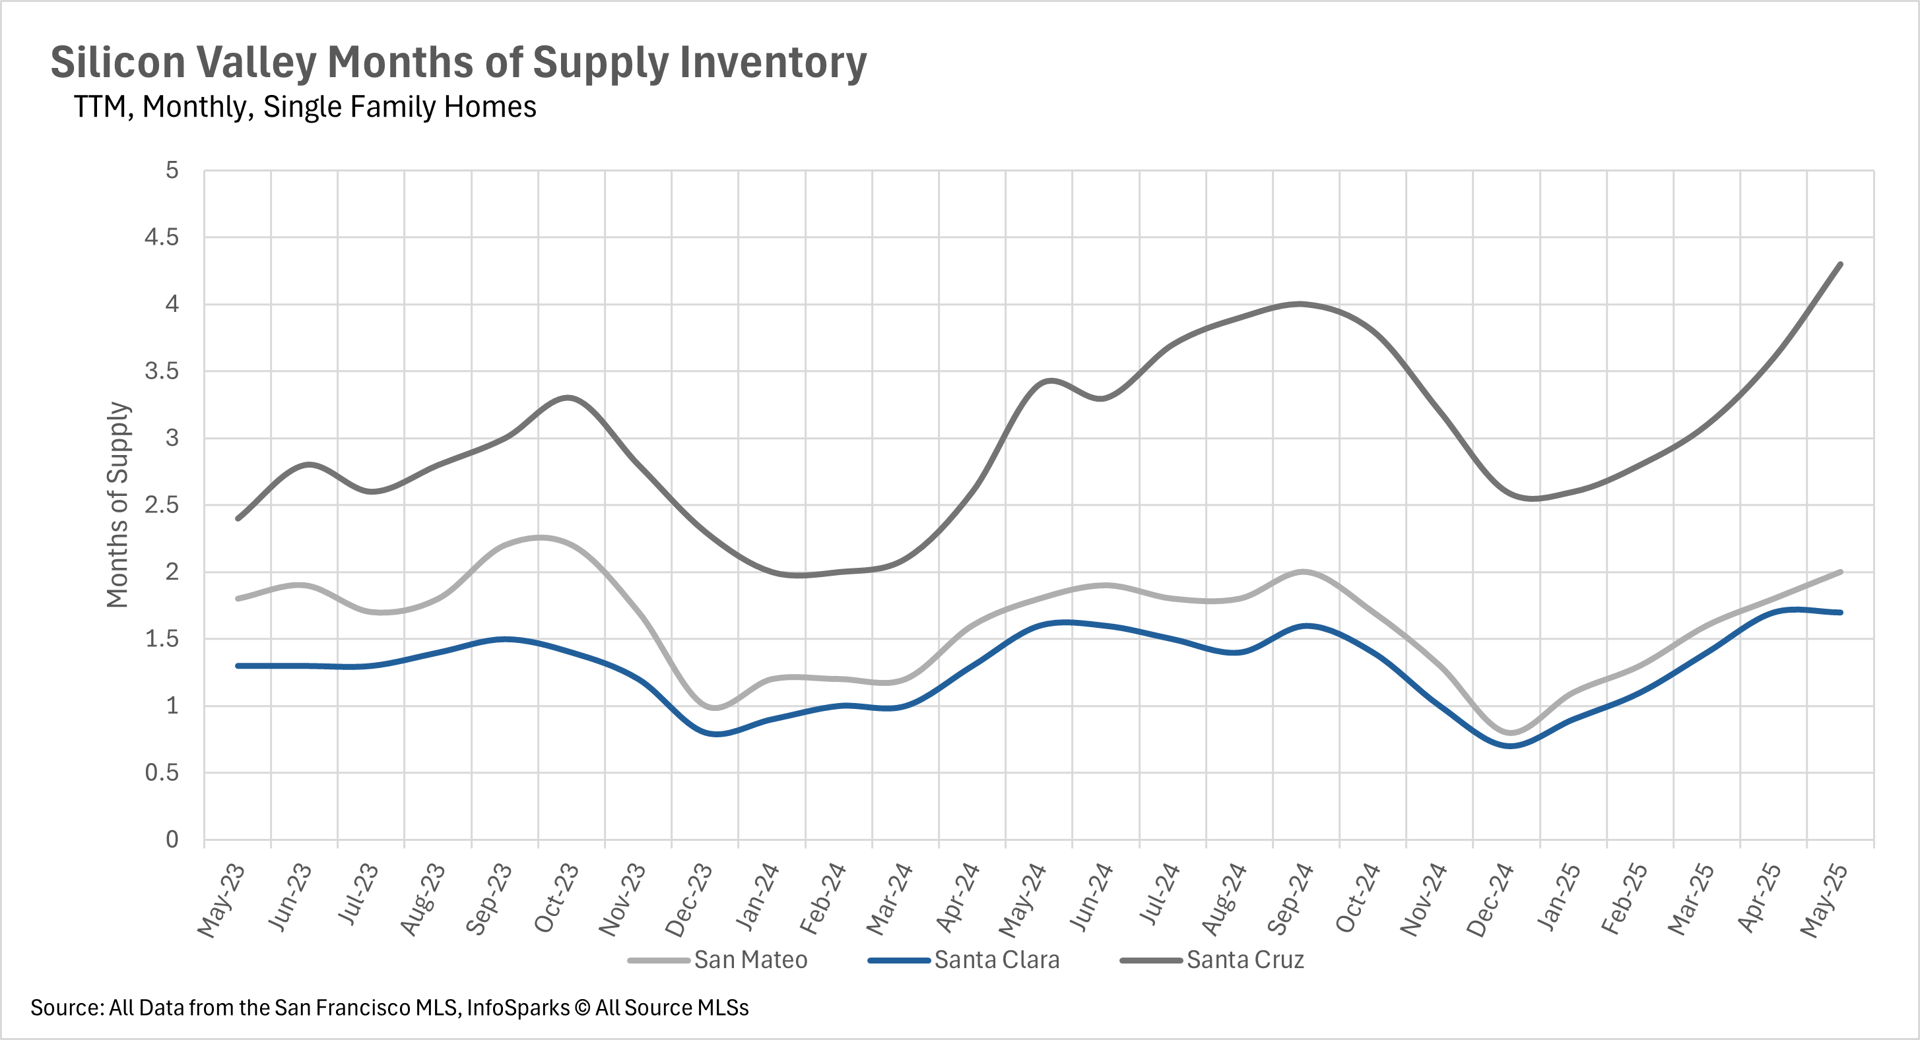
Although single-family homes are within their long-term average in terms of the amount of time they are spending on the market, the average condo is spending a tremendous amount of time on the market, with condos spending 46.15%, 111.11%, and 146.15% more days on the market on a year-over-year basis in Santa Clara, Santa Cruz, and San Mateo Counties, respectively. When you combine this with increased levels of inventory, buyers might be able to find some incredibly motivated sellers, and purchase a great property for an even better price!
Trends, prices, and insights shaping Silicon Valley housing this winter

Trends, prices, and insights shaping Silicon Valley housing this fall


You’ve got questions and we can’t wait to answer them.