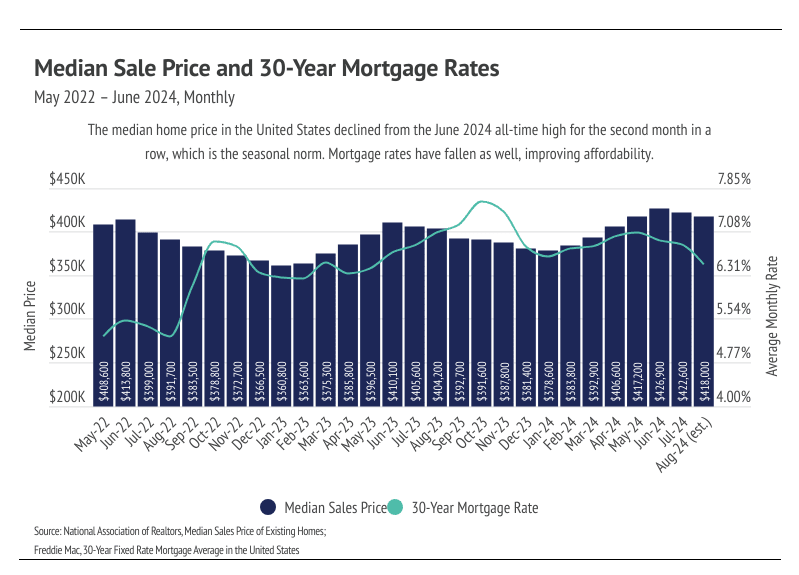
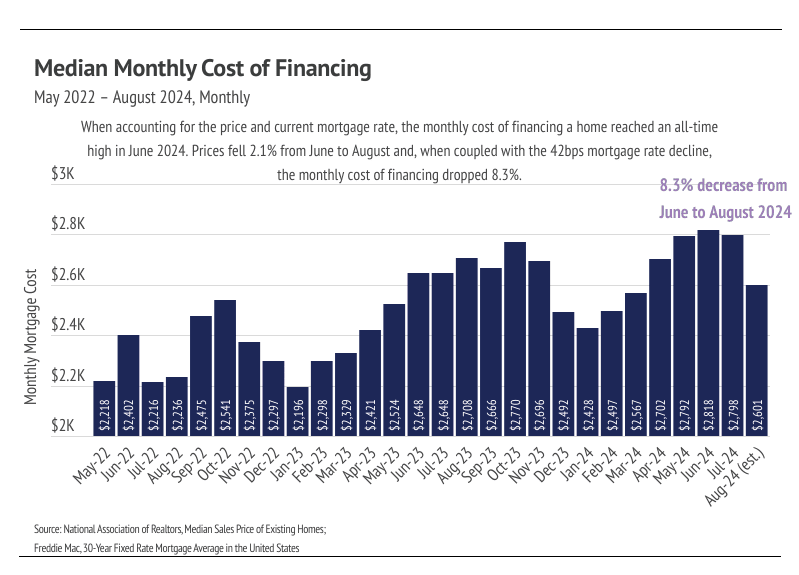
Despite low affordability through June 2024, affordability began improving in August 2024. The median U.S. home price reached a record high in June 2024, as did the monthly cost of financing a median-priced home, even though mortgage rates weren’t quite at their highest level this year. In other words, affordability hit a record low in June. Generally, prices tend to peak in June during any given year, even though the market veered away from this seasonality for a few years during the pandemic. It was no surprise, therefore, when prices declined slightly in July and August of this year. Additionally, during July and August, inflation lowered meaningfully, which means rate cuts. The anticipation of rate cuts alone led to lower rates in July and August. Over the past two months, the average 30-year mortgage rate fell 0.51%, which drastically improved affordability.
A rough but decent shorthand calculation for mortgage rates is that every 0.10% increase or decrease to mortgage rates equates to roughly a 1% increase or decrease in the monthly mortgage cost. This means that, over the past two months, the monthly payments on homes became approximately 5% cheaper.
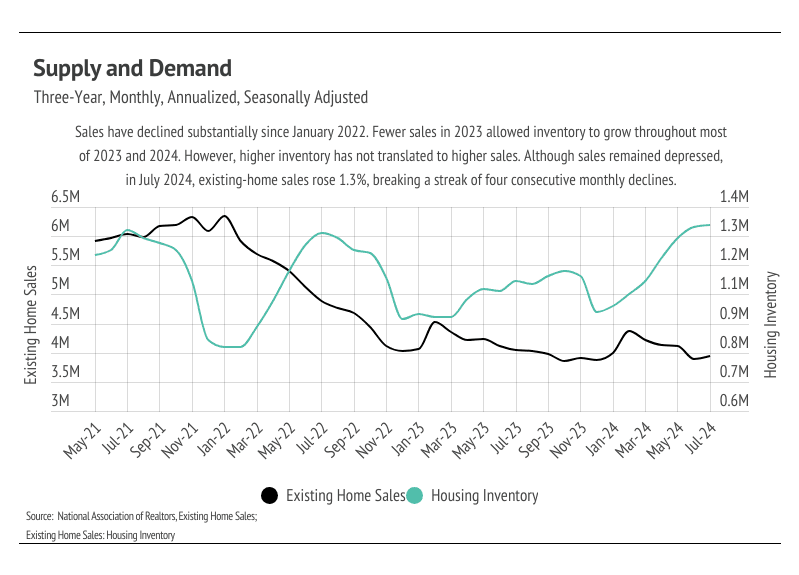
Sales and inventory generally also decline in the second half of the year. However, this historical trend has broken over the past couple of years. Sales have been historically low since January 2023; so, even though new listings have also been depressed, inventory has grown to its highest level since 2020. At this moment, homebuyers have more choice than they’ve had in years. Higher supply, lower price, and lower interest rates caused sales to increase month over month, albeit only slightly — up 1.3%.
Sales may continue to increase, however, because of the improving conditions, and sales levels are so low they almost have nowhere to go but up. The mid-September Fed meeting will likely bring about the first in a series of rate cuts, and the housing market may fare extremely well next year due to the timing of the cuts. The inventory build-up will likely slow for the rest of the year; but, since it’s already grown substantially, that isn’t concerning. We expect to enter 2025 with falling rates, high inventory, and seasonally lower home prices, which should create a perfect storm for a hotter spring market. We realize spring is a bit far; but, until then, we expect the sluggish market we’ve experienced over the past two years to persist, at least in terms of sales. The current market is favoring buyers, so if you’re thinking of buying, we can at least say that you have the most options to choose from.
Different regions and individual houses vary from the broad national trends, so we’ve included a Local Lowdown below to provide you with in-depth coverage for your area. As always, we will continue to monitor the housing and economic markets to best guide you in buying or selling your home.
Big Story Data
The Local Lowdown
-
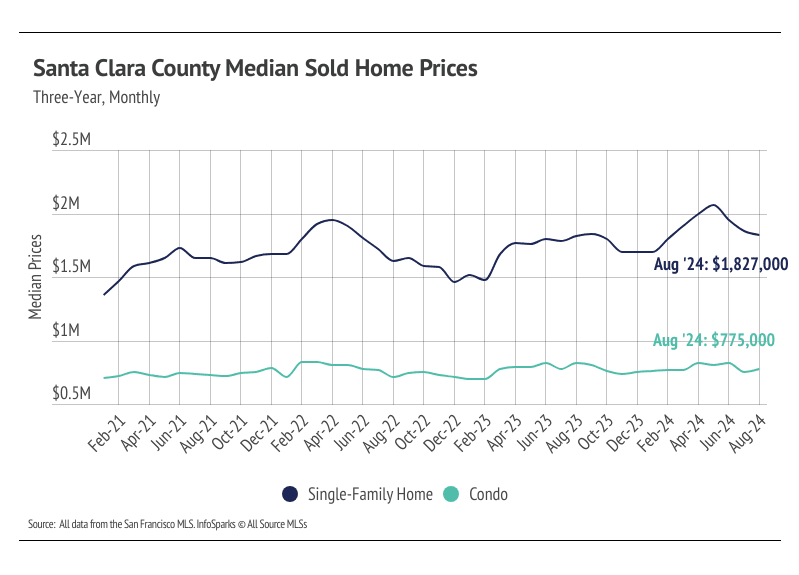
The median single-family home price fell 1.5% month over month, while condo prices rose 2.8%. We expect price contraction for the rest of the year, which is the seasonal norm.
-
Total inventory fell 6.9% month over month, as sales and homes under contract far outpaced new listings. We expect inventory to decline and the overall market to slow as we make our way through the second half of the year.
-
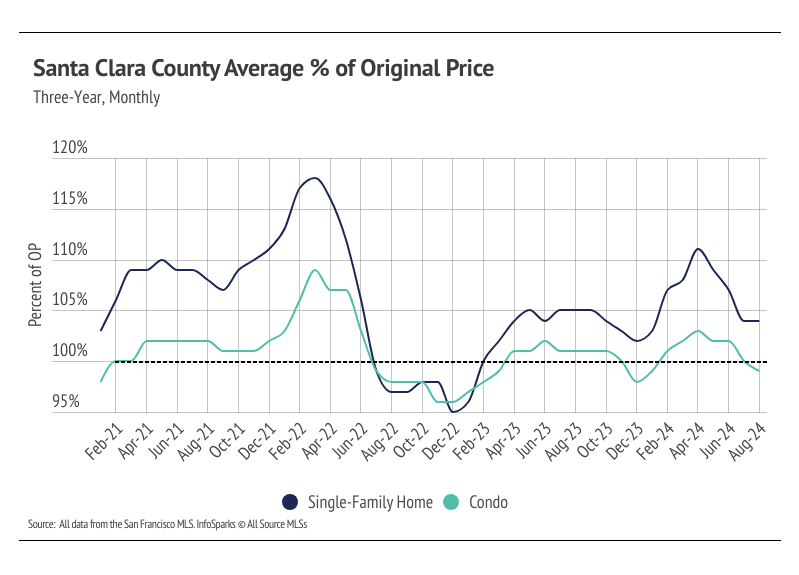
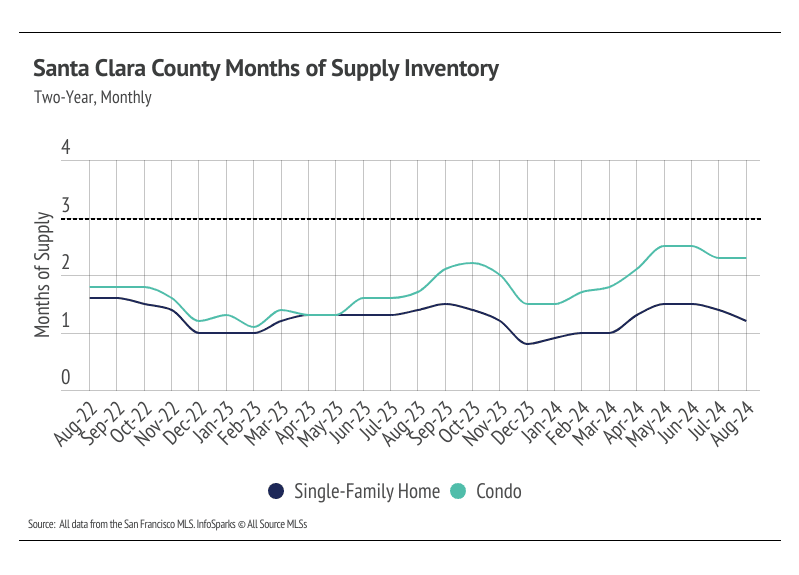
Months of Supply Inventory has declined month over month, indicating the market is improving for sellers. Currently, MSI indicates a sellers’ market for single-family homes condos.
Note: You can find the charts/graphs for the Local Lowdown at the end of this section.
The median single-family home prices declined month over month, which is the seasonal norm
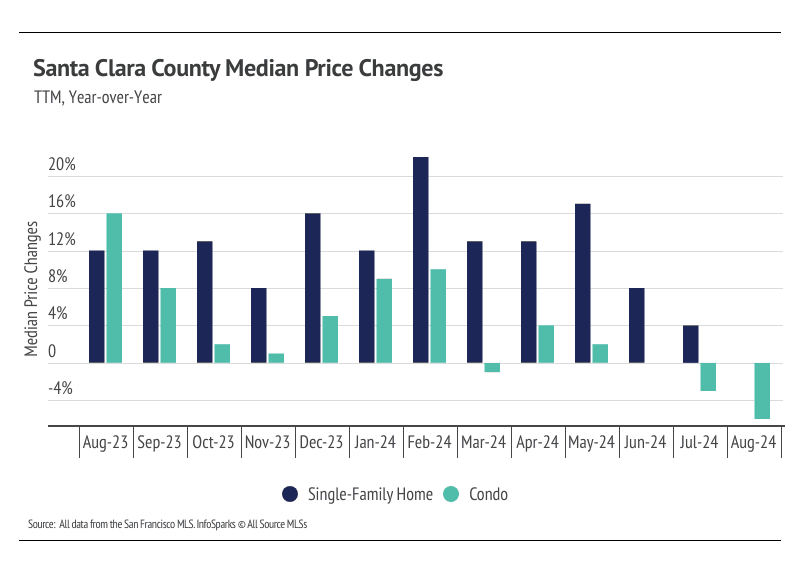
In Santa Clara, home prices haven’t been largely affected by rising mortgage rates after the initial period of price correction from April 2022 to December 2022. Since December 2022, the median single-family home price has trended higher, while condo prices have trended horizontally. Year over year, the median price was up 0.3% for single-family homes and down 7% for condos. Single-family home prices peaked in May 2024 and has since declined 11%. Prices are more likely to rise if more sellers come to the market. Inventory is so low that rising supply will only increase prices as buyers are better able to find the best match. More homes must come to the market to get anything close to a healthy market. That said, inventory, sales, and price typically peak in the first half of the year, so we expect contraction across those metrics for the rest of the year. Inventory is still low enough that it should create price support as supply declines in the second half of the year.
High mortgage rates soften both supply and demand, but home buyers and sellers seemed to tolerate rates near 6% much more than around 7%. Now that rates are declining, sales could get a little boost, but the housing market typically begins to slow as we make our way into fall.
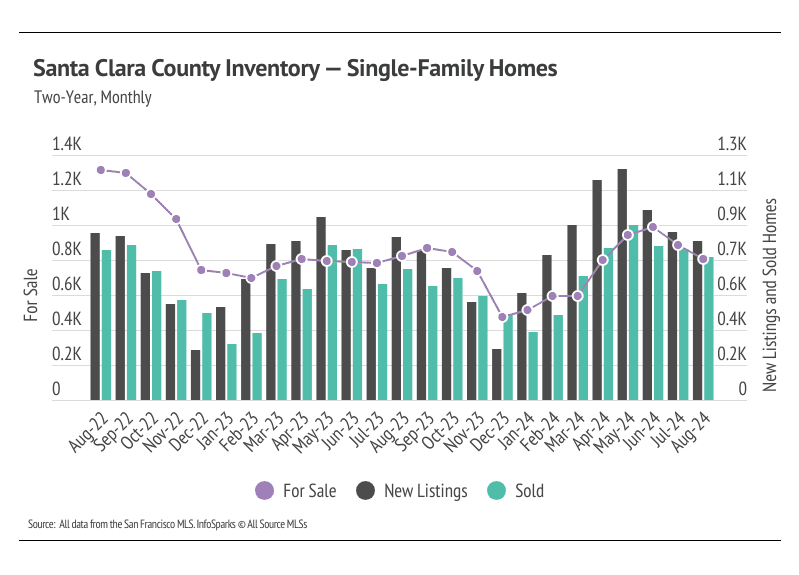
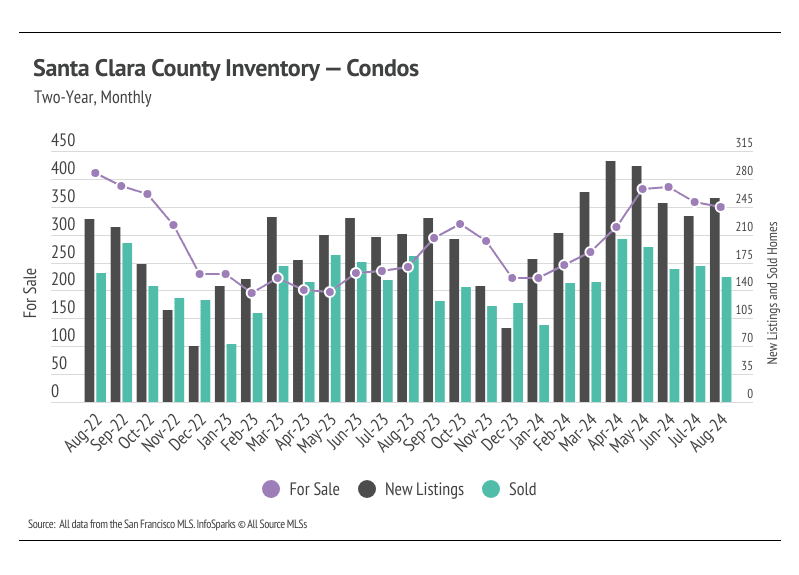
Sales, inventory, and new listings fell in August
In August, inventory and new listings declined, which is normal for this time of year, while home sales rose. Compared to this time last year, inventory has increased significantly, up 10%. Sales are up 9% for single-family homes, but condo sales declined 13%. Any amount of increasing inventory is good for the Santa Clara market. Inventory still has a long way to go before the market begins to become more balanced. When we take a longer look back and compare the supply of homes in August 2019 (pre-pandemic) to now, active listings have decreased by 62%. With that in mind, it’s actually quite impressive that sales have only declined by 18%.
Total inventory has trended lower essentially since 2010, but active listings fell precipitously from September 2019 to December 2021, as sales increased dramatically during that period. Supply became less volatile but still trended lower from January 2022 to the present — 32% lower than two years ago. Low inventory and new listings, coupled with high mortgage rates, have led to a substantial drop in sales and a generally slower housing market. Typically, inventory begins to increase in January or February, peaking in July or August before declining once again from the summer months to the winter. In 2023, sales and inventory didn’t resemble the typical seasonal peaks and valleys. It’s looking like 2024 inventory, sales, and new listings will follow historically seasonal patterns, albeit at a depressed level. It’s clear that supply will remain tight until spring 2025 at the earliest.
Months of Supply Inventory in August 2024 indicated a sellers’ market for single-family homes and condos
Months of Supply Inventory (MSI) quantifies the supply/demand relationship by measuring how many months it would take for all current homes listed on the market to sell at the current rate of sales. The long-term average MSI is around three months in California, which indicates a balanced market. An MSI lower than three indicates that there are more buyers than sellers on the market (meaning it’s a sellers’ market), while a higher MSI indicates there are more sellers than buyers (meaning it’s a buyers’ market). The San Mateo housing market tends to favor sellers, which is reflected in its low MSI, especially for single-family homes. MSI has been below three months since September 2012 (2012 is not a typo!) for single-family homes. Condo MSI was similar except that it rose above three in 2019 and 2020. For nearly four years, MSI has been below three months of supply, indicating a strong sellers’ market.