Silicon Valley Real Estate Market Update: November 2023 Insights and Analysis

Kevin Swartz  |  November 21, 2023

market update

Silicon Valley Real Estate Market Update: November 2023 Insights and Analysis

The Local Lowdown

Quick Take:
  • Year to date, single-family home prices are up across Silicon Valley. This year, condo prices were more mixed, with increases in San Mateo and Santa Clara, while Santa Cruz prices decreased. We expect home prices to remain fairly stable in the fourth quarter.
  • Active listings declined slightly from September to October, breaking an eight-month upward trend. Year over year, inventory is down 12%, highlighting one of the challenges of buying a home in a desirable market.
  • Months of Supply Inventory indicates the market is slowly shifting toward balance, but it is still a sellers’ market. It’s common for the market to trend toward balance in the fall and winter, when fewer buyers are in the market and sales slow.
Note: You can find the charts/graphs for the Local Lowdown at the end of this section.

Price growth slows across most of Silicon Valley

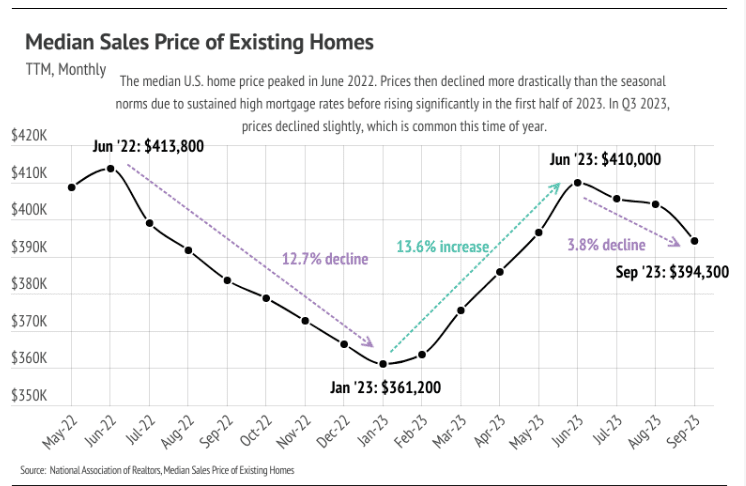
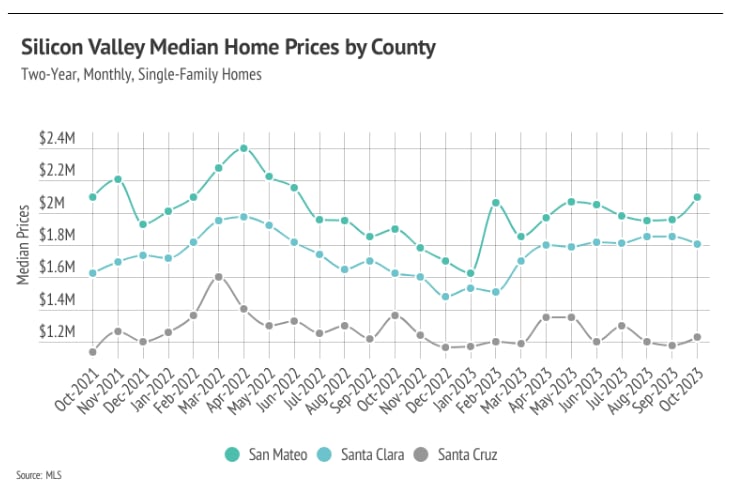
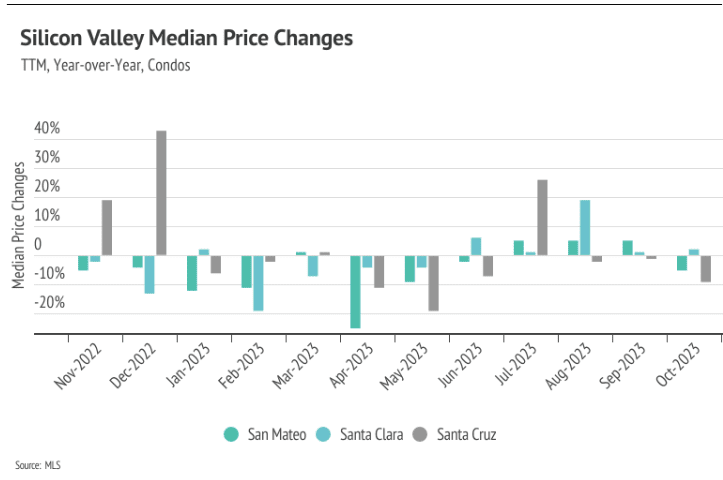
In Silicon Valley, home prices haven’t been largely affected by rising mortgage rates after the initial period of price correction from April 2022 to January 2023. In October, the median prices across most of the Silicon Valley counties were only slightly below their record highs. Increasing demand and low, but rising inventory helped drive the rapid home price appreciation that Silicon Valley experienced in the first half of the year. Single-family home and condo prices contracted over the past three months with the exception of San Mateo single-family home prices, which reached a high for the year in October. Year to date, prices have risen significantly across counties with the exception of Santa Cruz condo prices, which are down slightly. In the fourth quarter, we expect prices to remain fairly stable, but slight price contractions are normal this time of year.

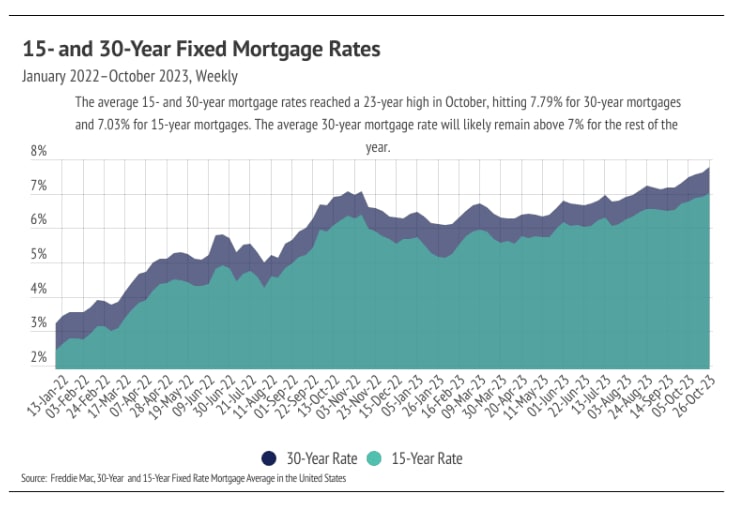
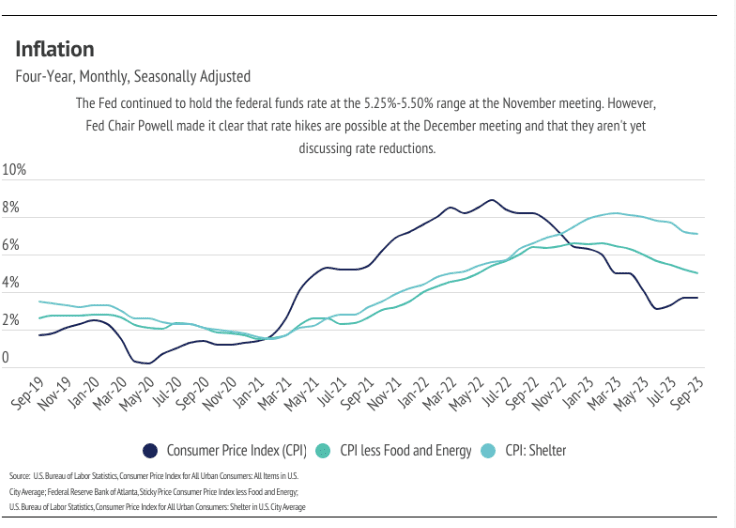
Typically, demand begins to decline in the fall and bottoms out in January, so the consistently low supply should be less of an issue. With mortgage rates at a 23-year high, buyers have more incentive to compete over the most desirable homes. Because of the cost of financing, homebuyers aren’t settling for less than the best home they can find.

Single-family home sales rose in October

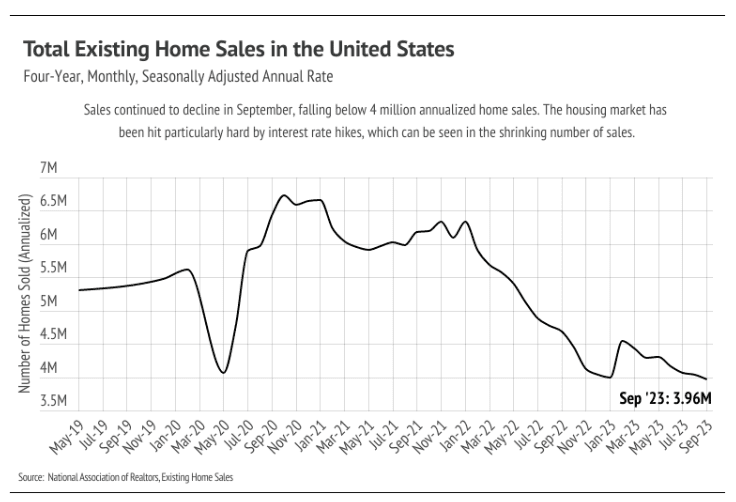
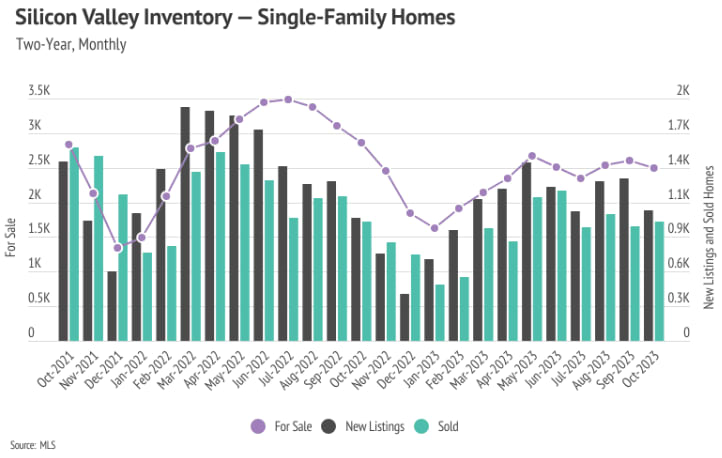
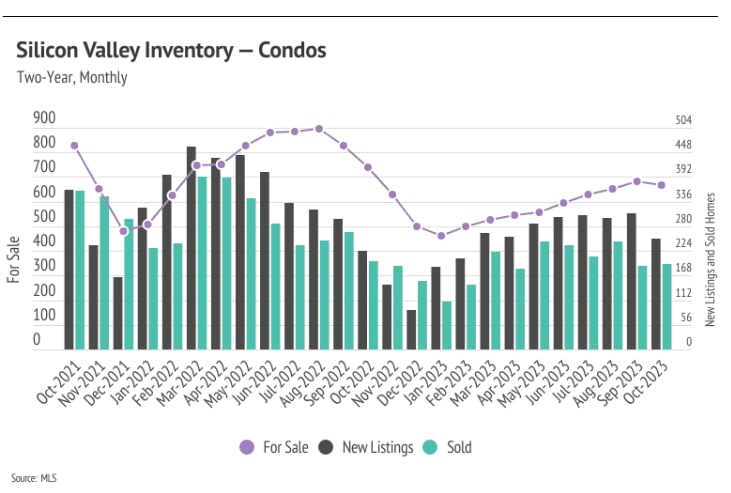
Single-family home inventory trended higher into the fall of 2023, peaking in September. Inventory declined in October as sales increased and new listings declined. Typically, inventory peaks in July or August and declines through December or January. Even though inventory increased this year, it’s still historically low, moving higher primarily due to softening demand (fewer sales) caused by higher interest rates, normal seasonality, and an atypical increase in new listings in September. The number of new listings coming to market is a significant predictor of sales. In September, new listings rose 2%, and in October, sales increased by 4%.

Even as demand slows, sellers are maintaining more negotiating power and receiving more than asking price on average. The average seller received 94% of list in January, which grew to 101% by May. From May to October, the average seller received 101% of list price in every month. Inventory will almost certainly remain historically low for the rest of the year, and will likely remain low in 2024, which will favor sellers.

Months of Supply Inventory indicates the market is trending toward balance, but it is still a sellers’ market

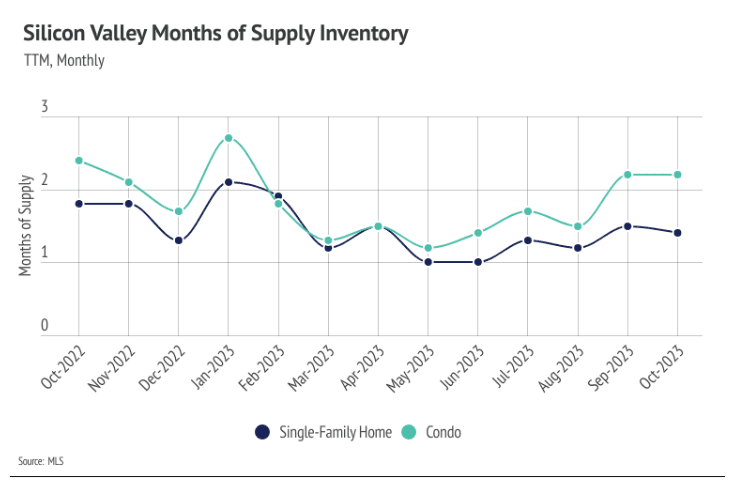
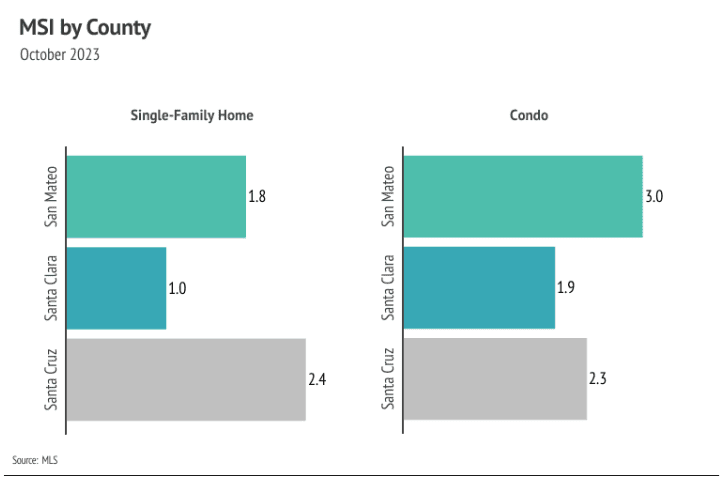
Months of Supply Inventory (MSI) quantifies the supply/demand relationship by measuring how many months it would take for all current homes listed on the market to sell at the current rate of sales. The long-term average MSI is around three months in California, which indicates a balanced market. An MSI lower than three indicates that there are more buyers than sellers on the market (meaning it’s a sellers’ market), while a higher MSI indicates there are more sellers than buyers (meaning it’s a buyers’ market). The Silicon Valley market tends to favor sellers, which is reflected in its low MSI. MSI fell sharply in the first quarter this year before gently trending higher starting in May. In October, MSI remained below three months of supply, indicating the market still favors sellers. The only exceptions are condos in San Mateo, which are closer to a balanced market.


Local Lowdown Data


The Big Story 

Fed policy is working, but mostly just on housing 

Quick Take:
  • The national median home price declined 3.8% in the third quarter, landing only 4.7% below the all-time high reached in June 2022 and reflecting typical seasonal trends. Prices didn’t contract significantly in Q3 2023 despite mortgage rates rising 0.6%.
  • In October, the average 30-year mortgage rate reached its highest level since October 2020 at 7.79%. Higher and higher rates continue to price potential buyers out of the market and prevent sellers who are locked into hyper-low rates from entering the market.
  • The Q3 Real Gross Domestic Product (inflation-adjusted GDP) rose 4.9% quarter over quarter, indicating a broadly strong economy. Although unemployment rose 0.3% to 3.9%, the jobs market remains robust. Inflation, which rose in Q3, is nearly double the Fed’s target rate of 2%, so rate reductions won’t happen in the near future.
Note: You can find the charts & graphs for the Big Story at the end of the following section.
 

It’s all about interest rates 

Home prices remain near all-time highs, largely due to the sustained low inventory levels, and despite the average 30-year mortgage rate hitting a 23-year high in October at 7.79%. It’s hard to overstate the full significance of higher mortgage rates on the housing market; but, in short, they are the primary driver of market slowdown. For example, when accounting for the cost of financing a mortgage, a buyer’s monthly cost for a median home today is actually 11% higher than in June 2022 when prices were at their peak. Looking further back to when the Fed began to raise rates at the beginning of 2022, the median monthly cost of a home has increased 76% from then until now.
 
So why have prices stayed elevated even as the cost of financing has skyrocketed over the past 22 months? For sellers, prices have to stay high or else they wouldn’t enter the market. Approximately 75% of U.S. homeowners have mortgage rates of less than 4%, according to JPMorgan, which has kept sellers from entering the market. If prices broadly contracted, even fewer sellers would come to market because they likely couldn’t afford a new house because their profit margin would be too low. Although people move for all sorts of reasons, generally speaking, there are very few sellers who are selling because they have no choice. Even if sellers were breaking even on their home sale, transitioning from a sub 4% mortgage to a nearly 8% rate is completely unappealing. Sellers who are coming to market now need to make a profit so that they can finance less of their next home in order to counteract the higher mortgage rate. Of course, this is for existing homes, but new construction isn’t much different. Material and financing costs are higher for homebuilders, too, and when a house costs more to build, the prices increase as well.
 
Inflation isn’t helping the market, either. People feel less wealthy than they did three years ago, and they’re right to feel that way. In just the three years from September 2020 to September 2023, the dollar has lost about 15% of its buying power, the same amount it lost over the preceding 10 years (September 2010 to September 2020). Even though inflation is declining, all that means is that prices are rising more slowly than last year — which is good, but it doesn't make anything more affordable. The combination of declining purchasing power and higher mortgage rates only reduces market participants, slowing the market.
 
High mortgage rates aren’t going away anytime soon because inflation is still about twice as high as the Fed would like. So far, most of the economic slowing the Fed intended by raising rates seems to be isolated to the housing market. The National Association of Realtors (NAR) reported that the number of homes sold dropped 2.0% month over month and 15.4% year over year to the lowest number of sales in the four years that NAR reports. Real GDP rose significantly in Q3 2023, indicating strong U.S. economic growth rather than economic slowdown. It’s unlikely that the Fed will hike rates at the December meeting, and very unlikely that they will reduce rates in the near future. We can expect mortgage rates between 7% and 8% in 2024, which will continue to slow the market.
 
Different regions and individual houses vary from the broad national trends, so we’ve included a Local Lowdown below to provide you with in-depth coverage for your area. In general, higher-priced regions (the West and Northeast) have been hit harder by mortgage rate hikes than less expensive markets (the South and Midwest) because of the absolute dollar cost of the rate hikes and limited ability to build new homes. As always, we will continue to monitor the housing and economic markets to best guide you in buying or selling your home.
 

Big Story Data 


Let’s Talk

You’ve got questions and we can’t wait to answer them.

Follow Us on Instagram